Gold Breakdown Alert: Rejection from Resistance Signals Downside
🔹Technical Analysis: Gold (XAU/USD) – 4-Hour Chart
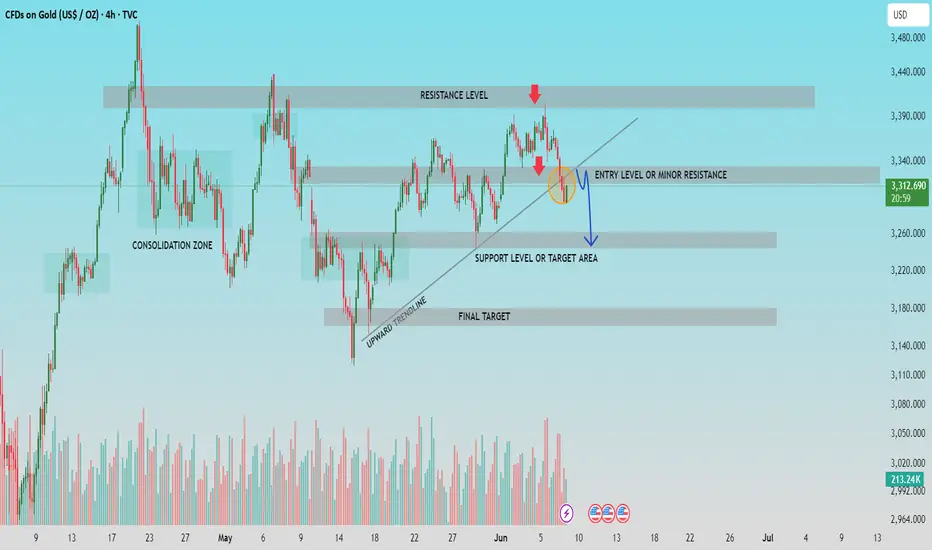
▪️Market Structure & Trendline Break
▫️ Price has broken below the upward trendline, indicating a potential shift in market sentiment from bullish to bearish.
▫️ The failure to sustain above the resistance level near $3,390-$3,440 led to a pullback and bearish rejection (marked by red arrows).
▪️Key Levels
▫️ Minor Resistance / Entry Level: $3,320-$3,340 area may now act as a resistance zone after the trendline break, providing a potential short entry level.
▫️ Support Level / First Target: $3,250-$3,270 zone is identified as the next major support and short-term target.
▫️ Final Target: A deeper correction could push price towards the $3,160-$3,180 region.
▪️Trade Outlook
▫️Current price action suggests a bearish outlook, with potential for a downward move from the minor resistance area.
▫️ Traders may look for sell opportunities on pullbacks into the $3,320-$3,340 zone with confirmation.
▪️Volume Analysis
▫️ Volume has spiked during the breakdown, indicating strong selling interest, supporting the case for downside continuation.
▫️Bias: Bearish, targeting lower support zones after trendline breakdown.
🔹Community Insight:
If you find this analysis helpful in your trading journey, feel free to share your thoughts or questions in the comments. Let’s work together to maintain a disciplined, technical approach to the markets.
▪️Follow for regular updates and trade setups.
Trade active
from 3326Note
trade running 140 pips+Note
one more layer added from 3334, after candlestick confirmations , Note
Note
after breakdown 3311level , trade activated here, 3311..targets are downside...
Trade closed manually
in good pips like 420 Related publications
Disclaimer
The information and publications are not meant to be, and do not constitute, financial, investment, trading, or other types of advice or recommendations supplied or endorsed by TradingView. Read more in the Terms of Use.
Related publications
Disclaimer
The information and publications are not meant to be, and do not constitute, financial, investment, trading, or other types of advice or recommendations supplied or endorsed by TradingView. Read more in the Terms of Use.