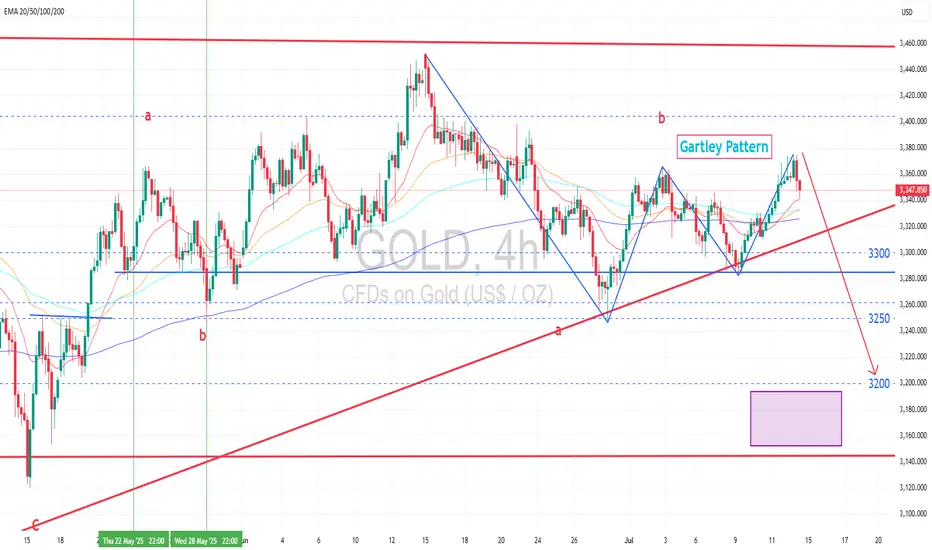
Gold price has completed a Gartley pattern and is now in leg C of a corrective wave.
Analysis by: Krisada Yoonaisil, Financial Markets Strategist at Exness
- Gold appears to start a downtrend following the completion of a Gartley pattern. This move suggests a potential bearish reversal, with the current decline likely marking the start of a sustained move to make a significant lower low, rather than a short-term pullback.
- The price of gold peaked at 3375, which is at the key 61.8% Fibonacci retracement level. A reversal to start a new downtrend is therefore possible.
- In terms of Elliott Wave theory, this can be counted as the completion of sub-wave c of wave B of a bearish corrective wave. Therefore, this downtrend is likely to see a lower low than the trough made on July 9th and the downtrend might last for 1-2 weeks.
- This decline is likely starting from to a profit-taking sell-off on rebound.
- During this period, the US dollar, which appears to be recovering at least in the short term, could add further pressure on the gold price.
- US CPI data, set for release tomorrow (July 15), is widely expected to show an increase. A stronger inflation reading would likely prompt the Fed to delay rate cuts, reinforcing its hawkish stance and dampening speculative appetite for gold.
- Over the next 1–2 months, the Fed is unlikely to take action as per a cautious stance due to tariffs, which may leave gold prices directionless in the near term due to the absence of clear monetary signals.
Analysis by: Krisada Yoonaisil, Financial Markets Strategist at Exness
Disclaimer
The information and publications are not meant to be, and do not constitute, financial, investment, trading, or other types of advice or recommendations supplied or endorsed by TradingView. Read more in the Terms of Use.
Disclaimer
The information and publications are not meant to be, and do not constitute, financial, investment, trading, or other types of advice or recommendations supplied or endorsed by TradingView. Read more in the Terms of Use.