Gold (XAU/USD) 15-Minute Chart Analysis – July 17, 2025
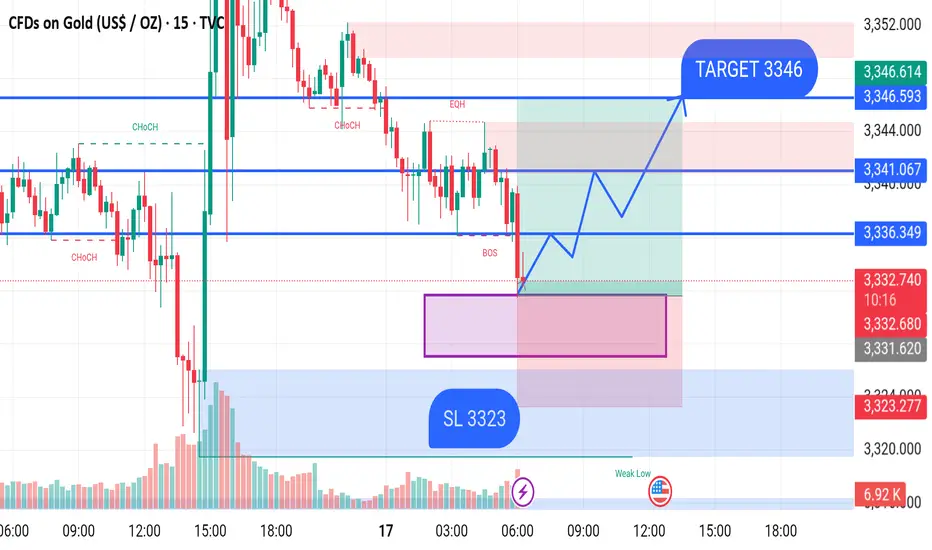
Price is currently trading around the 3,333.71 level after a Break of Structure (BOS) to the downside. The market has entered a demand zone (highlighted in pink), suggesting potential bullish momentum if the zone holds.
A possible bullish scenario is illustrated on the chart:
Price is expected to retest the demand zone between 3,331 – 3,324.
From this zone, a bullish reversal is anticipated with higher highs and higher lows.
If the bullish move plays out, the first resistance level lies around 3,336 – 3,341.
The final target is set at 3,346, marked as the Take Profit (TP) level.
Key Levels:
Entry Zone (Demand Zone): 3,331 – 3,324
Stop Loss (SL): 3,323
Target (TP): 3,346
Intermediate Resistance Levels: 3,336 and 3,341
Premium Signals | Consistent Profits
DM for access & Trade Smarter
TG : t.me/GOLDPIPSSNIPERm
EXness: one.exnesstrack.org/a/m14yhu78xv
DM for access & Trade Smarter
TG : t.me/GOLDPIPSSNIPERm
EXness: one.exnesstrack.org/a/m14yhu78xv
Disclaimer
The information and publications are not meant to be, and do not constitute, financial, investment, trading, or other types of advice or recommendations supplied or endorsed by TradingView. Read more in the Terms of Use.