🔹Technical Analysis: Gold (XAU/USD) – 30-Minute Chart
▪️Support and Resistance Levels
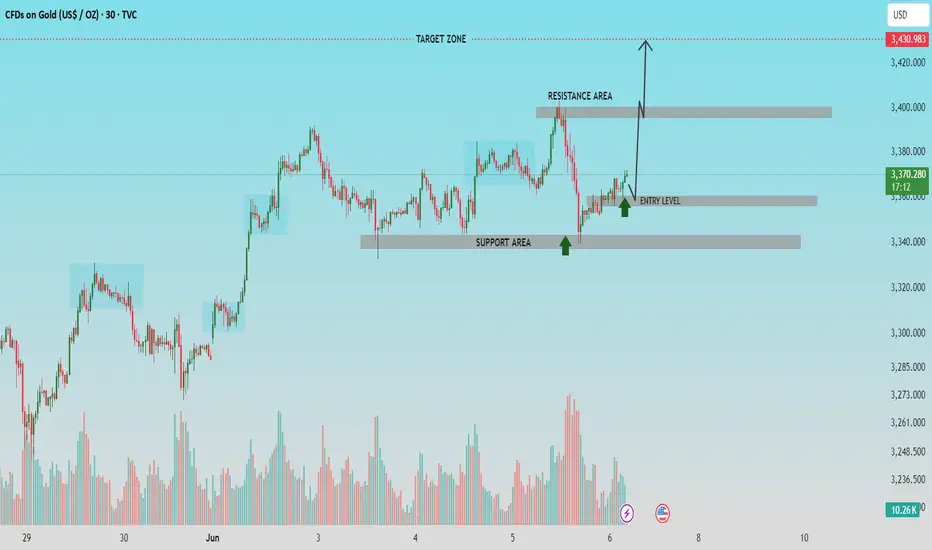
▪️ Support Area: The price has shown strong buying interest near the $3,345-$3,350 zone, where price action reversed with bullish momentum.
▪️ Resistance Area: Price faces significant resistance near the $3,395-$3,405 region, which acted as a previous supply zone.
🔹Entry and Target
▪️ Entry Level: The chart suggests an ideal buy entry around the $3,360-$3,365 level after the recent support confirmation (green arrows).
▪️ Target Zone: The projected upside target is around $3,430, representing a clean break and continuation above the resistance area.
▪️Outlook
The market shows a bullish structure after bouncing off the support area and breaking minor consolidation. A breakout above the resistance zone could lead to a rally towards the target zone. Traders should monitor for bullish confirmation above the resistance area for continuation.
▪️Volume Observation
An increase in bullish volume supports the likelihood of upward momentum, reinforcing the potential for a breakout.
▪️Bias: Bullish, with confirmation above resistance.
🔹Community Insight:
If you find this analysis helpful in your trading journey, feel free to share your thoughts or questions in the comments. Let’s work together to maintain a disciplined, technical approach to the markets.
▪️Follow for regular updates and trade setups.
▪️Support and Resistance Levels
▪️ Support Area: The price has shown strong buying interest near the $3,345-$3,350 zone, where price action reversed with bullish momentum.
▪️ Resistance Area: Price faces significant resistance near the $3,395-$3,405 region, which acted as a previous supply zone.
🔹Entry and Target
▪️ Entry Level: The chart suggests an ideal buy entry around the $3,360-$3,365 level after the recent support confirmation (green arrows).
▪️ Target Zone: The projected upside target is around $3,430, representing a clean break and continuation above the resistance area.
▪️Outlook
The market shows a bullish structure after bouncing off the support area and breaking minor consolidation. A breakout above the resistance zone could lead to a rally towards the target zone. Traders should monitor for bullish confirmation above the resistance area for continuation.
▪️Volume Observation
An increase in bullish volume supports the likelihood of upward momentum, reinforcing the potential for a breakout.
▪️Bias: Bullish, with confirmation above resistance.
🔹Community Insight:
If you find this analysis helpful in your trading journey, feel free to share your thoughts or questions in the comments. Let’s work together to maintain a disciplined, technical approach to the markets.
▪️Follow for regular updates and trade setups.
Trade active
Note
trade running 100 pips+Related publications
Disclaimer
The information and publications are not meant to be, and do not constitute, financial, investment, trading, or other types of advice or recommendations supplied or endorsed by TradingView. Read more in the Terms of Use.
Related publications
Disclaimer
The information and publications are not meant to be, and do not constitute, financial, investment, trading, or other types of advice or recommendations supplied or endorsed by TradingView. Read more in the Terms of Use.