🔹Gold (XAU/USD) – 30-Minute Chart Technical Outlook
▪️Market Structure:
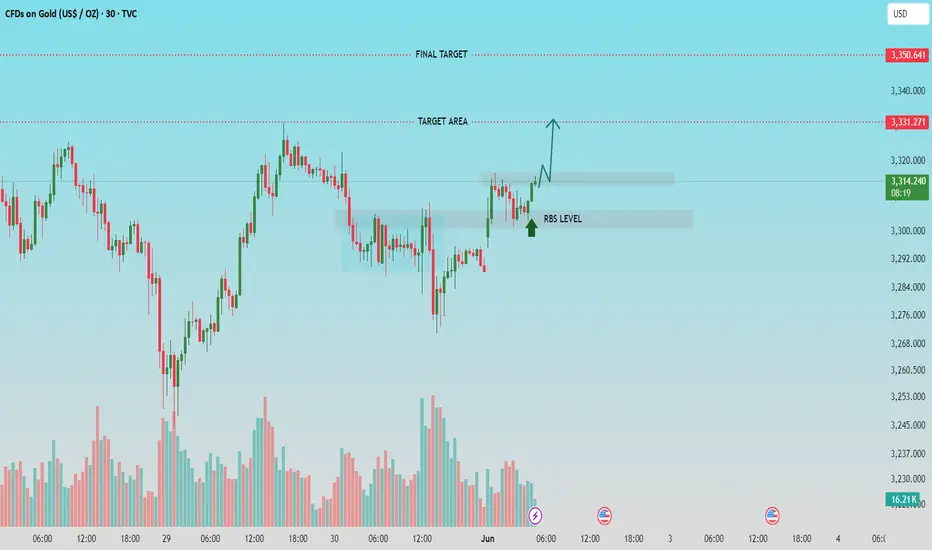
Gold is currently showing signs of bullish continuation following a breakout above a previous resistance area, now turned RBS (Resistance Becomes Support) level near $3,308-$3,310.
▪️Key Levels:
* RBS Level: $3,308 (prior resistance, now acting as support)
* Target Area: $3,331
* Final Target: $3,351
▪️Price Action Insight:
After a brief consolidation, price has broken above short-term resistance and is retesting the RBS level, confirming it as new support. Bullish momentum is indicated by the rising volume during the breakout phase and a strong bullish candle retesting support.
▪️Trade Bias:
* Bullish Bias: As long as price holds above the RBS zone, continuation toward the target area at $3,331 is likely.
* If momentum sustains, final target at $3,351 remains in sight.
* A breakdown below the RBS level would invalidate this bullish setup and suggest reevaluation.
▪️Conclusion:
The current structure favors buyers, with confirmation of support at the RBS level providing a potential low-risk entry for a long position. Targets are clearly defined, with favorable risk-to-reward as long as price sustains above the breakout zone.
🔹Community Insight:
If you find this analysis helpful in your trading journey, feel free to share your thoughts or questions in the comments. Let’s work together to maintain a disciplined, technical approach to the markets.
▪️Follow for regular updates and trade setups.
▪️Market Structure:
Gold is currently showing signs of bullish continuation following a breakout above a previous resistance area, now turned RBS (Resistance Becomes Support) level near $3,308-$3,310.
▪️Key Levels:
* RBS Level: $3,308 (prior resistance, now acting as support)
* Target Area: $3,331
* Final Target: $3,351
▪️Price Action Insight:
After a brief consolidation, price has broken above short-term resistance and is retesting the RBS level, confirming it as new support. Bullish momentum is indicated by the rising volume during the breakout phase and a strong bullish candle retesting support.
▪️Trade Bias:
* Bullish Bias: As long as price holds above the RBS zone, continuation toward the target area at $3,331 is likely.
* If momentum sustains, final target at $3,351 remains in sight.
* A breakdown below the RBS level would invalidate this bullish setup and suggest reevaluation.
▪️Conclusion:
The current structure favors buyers, with confirmation of support at the RBS level providing a potential low-risk entry for a long position. Targets are clearly defined, with favorable risk-to-reward as long as price sustains above the breakout zone.
🔹Community Insight:
If you find this analysis helpful in your trading journey, feel free to share your thoughts or questions in the comments. Let’s work together to maintain a disciplined, technical approach to the markets.
▪️Follow for regular updates and trade setups.
Trade active
Note
Trade closed: target reached
Related publications
Disclaimer
The information and publications are not meant to be, and do not constitute, financial, investment, trading, or other types of advice or recommendations supplied or endorsed by TradingView. Read more in the Terms of Use.
Related publications
Disclaimer
The information and publications are not meant to be, and do not constitute, financial, investment, trading, or other types of advice or recommendations supplied or endorsed by TradingView. Read more in the Terms of Use.