Here’s a breakdown of the idea:
Pattern Overview:
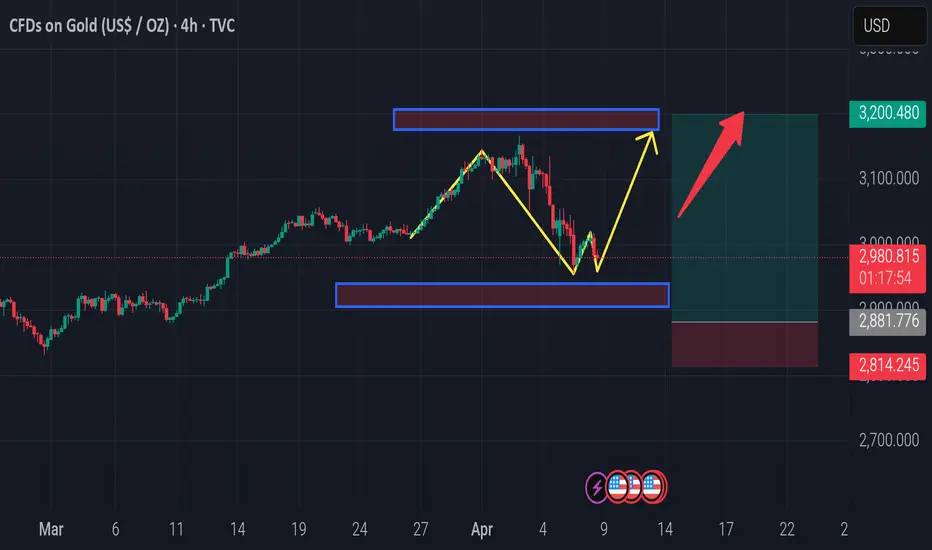
Left Shoulder: Initial dip and bounce.
Head: Deeper low followed by a recovery.
Right Shoulder: Higher low, currently forming.
Neckline: Around the $3,030–$3,040 zone (marked by the top blue box).
Bullish Setup:
If price breaks above the neckline (blue resistance zone), it could confirm the reversal.
Target based on the pattern's height (Head to Neckline) gives a potential move to ~$3,200+, aligning with your green target box.
Trade Idea:
Entry: On neckline breakout or slight retest (around $3,030–$3,050).
Target: $3,200.
Stop-Loss: Below the recent low ($2,880 or tighter depending on your risk tolerance).
Timeframe Expectation:
Given it's on a 4H chart, a breakout and follow-through to the $3,200 zone could play out in the next 2–4 weeks
Pattern Overview:
Left Shoulder: Initial dip and bounce.
Head: Deeper low followed by a recovery.
Right Shoulder: Higher low, currently forming.
Neckline: Around the $3,030–$3,040 zone (marked by the top blue box).
Bullish Setup:
If price breaks above the neckline (blue resistance zone), it could confirm the reversal.
Target based on the pattern's height (Head to Neckline) gives a potential move to ~$3,200+, aligning with your green target box.
Trade Idea:
Entry: On neckline breakout or slight retest (around $3,030–$3,050).
Target: $3,200.
Stop-Loss: Below the recent low ($2,880 or tighter depending on your risk tolerance).
Timeframe Expectation:
Given it's on a 4H chart, a breakout and follow-through to the $3,200 zone could play out in the next 2–4 weeks
Don't go anywhere Just stay tuned My Channel getting more accurate signal Daily
professional Trader
professional Trader
Disclaimer
The information and publications are not meant to be, and do not constitute, financial, investment, trading, or other types of advice or recommendations supplied or endorsed by TradingView. Read more in the Terms of Use.