🧭 GOLD 2H STRUCTURE ROADMAP – JULY 2025
📉 Market Structure | 📊 Liquidity Zones | 🎯 Bearish Scenario
---
📌 🧱 Structure Analysis – Bigger Picture
The current macro structure on Gold is clearly bearish, confirmed by:
A sequence of Lower Highs (LH) and Lower Lows (LL)
Price respecting a descending channel / wedge structure
Failure to hold above key break-of-structure (BOS) zones on prior rallies
Recent rallies forming corrective patterns, not impulsive bullish structure
This indicates that smart money is distributing at higher levels and planning liquidity raids before final markdowns.
---
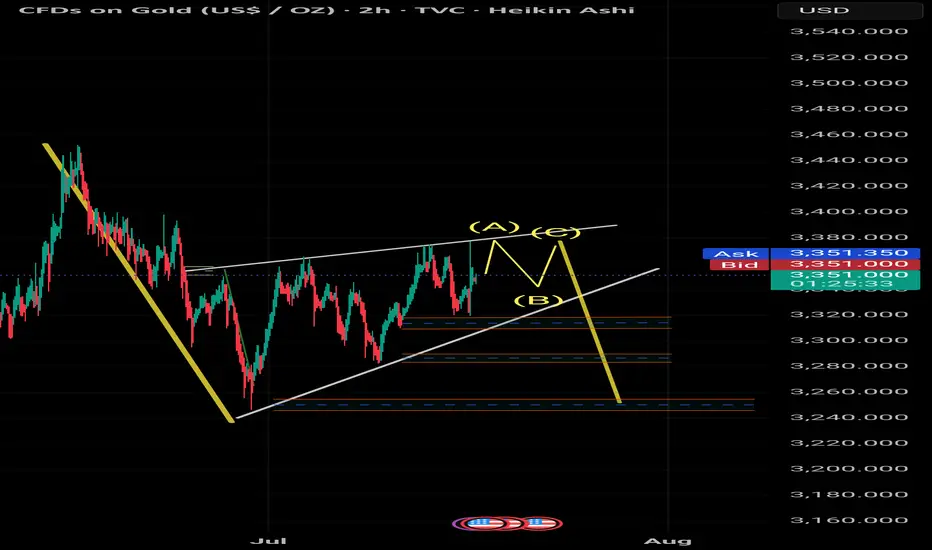
🔁 Wedge + ABC Trap Formation
The chart shows a classic bearish wedge (rising contraction pattern) with an embedded ABC correction, which can trap long-biased retail traders before reversal.
Wave (A): Short-term rejection at previous minor high
Wave (B): Shallow pullback to create illusion of strength
Wave (C): Final liquidity sweep above the wedge → Perfect trap zone
---
💧 Triple Liquidity Targets – Smart Money Blueprint
Smart money often targets liquidity in layers. Below are the three major zones:
1. 🔻 First Liquidity Pool (~$3,320 – $3,310):
Minor internal structure lows with previous BOS area
2. 🔻 Second Pool (~$3,285 – $3,275):
Strong liquidity cluster near order block formed after impulsive move
3. 🔻 Final Demand Zone (~$3,245 – $3,260):
Deep liquidity + unmitigated bullish OB = High Probability Reaction Zone
---
⚔️ Bias & Trading Insight
✅ Bias: Bearish unless price closes above $3,400 with strength
🚫 Avoid chasing longs during (B)-(C) unless clear breakout + volume
🧠 Patience pays — Wait for sweep of all three zones before any long-term bullish commitment
---
> 🧠 Precision Analysis by: Mohsen Mozafarinezhad
👑 Presented under: PERSIAUX KING — A Legacy of Persian Discipline in Markets
📉 Market Structure | 📊 Liquidity Zones | 🎯 Bearish Scenario
---
📌 🧱 Structure Analysis – Bigger Picture
The current macro structure on Gold is clearly bearish, confirmed by:
A sequence of Lower Highs (LH) and Lower Lows (LL)
Price respecting a descending channel / wedge structure
Failure to hold above key break-of-structure (BOS) zones on prior rallies
Recent rallies forming corrective patterns, not impulsive bullish structure
This indicates that smart money is distributing at higher levels and planning liquidity raids before final markdowns.
---
🔁 Wedge + ABC Trap Formation
The chart shows a classic bearish wedge (rising contraction pattern) with an embedded ABC correction, which can trap long-biased retail traders before reversal.
Wave (A): Short-term rejection at previous minor high
Wave (B): Shallow pullback to create illusion of strength
Wave (C): Final liquidity sweep above the wedge → Perfect trap zone
---
💧 Triple Liquidity Targets – Smart Money Blueprint
Smart money often targets liquidity in layers. Below are the three major zones:
1. 🔻 First Liquidity Pool (~$3,320 – $3,310):
Minor internal structure lows with previous BOS area
2. 🔻 Second Pool (~$3,285 – $3,275):
Strong liquidity cluster near order block formed after impulsive move
3. 🔻 Final Demand Zone (~$3,245 – $3,260):
Deep liquidity + unmitigated bullish OB = High Probability Reaction Zone
---
⚔️ Bias & Trading Insight
✅ Bias: Bearish unless price closes above $3,400 with strength
🚫 Avoid chasing longs during (B)-(C) unless clear breakout + volume
🧠 Patience pays — Wait for sweep of all three zones before any long-term bullish commitment
---
> 🧠 Precision Analysis by: Mohsen Mozafarinezhad
👑 Presented under: PERSIAUX KING — A Legacy of Persian Discipline in Markets
Disclaimer
The information and publications are not meant to be, and do not constitute, financial, investment, trading, or other types of advice or recommendations supplied or endorsed by TradingView. Read more in the Terms of Use.
Disclaimer
The information and publications are not meant to be, and do not constitute, financial, investment, trading, or other types of advice or recommendations supplied or endorsed by TradingView. Read more in the Terms of Use.