Spot gold hit a new record high, with prices hitting $3,400 in the European session, continuing last week's strong upward momentum. Gold is currently in a typical bullish trend channel, with technical indicators showing overbought conditions, but fundamental positives continue to push gold prices higher.
Fundamental analysis
The U.S. dollar index fell to a recent low, providing strong support for gold. The Trump administration's move on April 2 to impose "reciprocal tariffs" on multiple countries has heightened market concerns about slowing global economic growth. Although the United States has suspended tariffs on some countries, global trade frictions continue to escalate, exacerbating market risk aversion.
IG market strategists pointed out: "The market is pricing in increased geopolitical risks caused by U.S. tariff tensions and stagflation concerns, and the resilience of central bank demand has also provided additional support for gold prices."
Iran and the United States recently reached an agreement to begin expert-level discussions to design a framework for a potential nuclear agreement. At the same time, Russia's one-day ceasefire in Ukraine has also raised hopes that tensions may ease. However, these factors do not seem to have significantly boosted market confidence or weakened demand for traditional safe-haven assets.
Technical analyst interpretation:
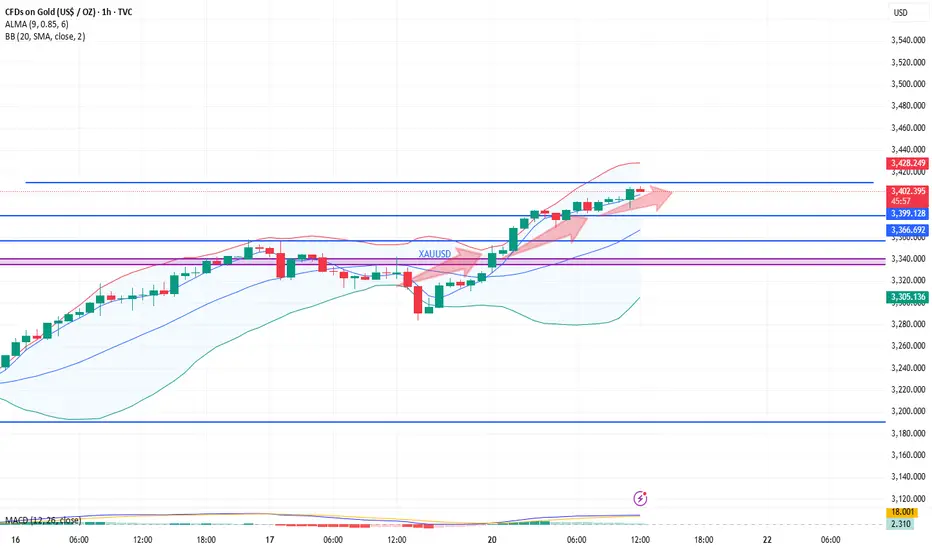
From the 60-minute chart analysis, the recent trend of gold prices shows a clear upward channel pattern. Starting from the low of $3193.67, the price has formed a strong upward trend and has now broken through the $3370 mark, setting a record high of $3400. The MA55 moving average is at $3330.41, and the MA14 is at $3370.21. The moving average system is in a bullish arrangement, indicating that the current trend is strong. The MACD indicator shows that the DIFF value is 19.85, the DEA is 16.34, and the MACD value is 7.04. The bar chart remains above the zero axis, indicating that the short-term momentum is still upward. The RSI indicator is at 71.43, which has entered the overbought area, but there has been no obvious top divergence signal.
From the daily cycle, the gold price has started a large-scale rise since $2583.01, and has now broken through multiple psychological barriers in succession. The daily MACD indicator DIFF value is 92.15, the DEA value is 66.08, and the MACD value is 52.14. The bar chart continues to expand, indicating strong medium-term upward momentum. The RSI indicator reached a high of 76.17, which is obviously overbought. The CCI indicator is at 143.16, which is also in the overbought area, but has not yet formed an obvious top divergence pattern.
Market sentiment observation
The current market sentiment is obviously biased towards risk aversion, and gold continues to be favored as a traditional safe-haven asset. The Trump administration's "reciprocal tariff" policy has caused market concerns about the outlook for the global economy and has driven funds to safe-haven assets. Although technical indicators show that gold is overbought and the relative strength index (RSI) has reached around 75, market panic is still supporting the upward trend of gold prices.
However, it is worth noting that in the short term, the market may have a demand for profit-taking adjustments, and the accumulation of overbought signals also prompts traders to pay attention to potential technical adjustments. XAUUSD XAUUSD GOLD
Fundamental analysis
The U.S. dollar index fell to a recent low, providing strong support for gold. The Trump administration's move on April 2 to impose "reciprocal tariffs" on multiple countries has heightened market concerns about slowing global economic growth. Although the United States has suspended tariffs on some countries, global trade frictions continue to escalate, exacerbating market risk aversion.
IG market strategists pointed out: "The market is pricing in increased geopolitical risks caused by U.S. tariff tensions and stagflation concerns, and the resilience of central bank demand has also provided additional support for gold prices."
Iran and the United States recently reached an agreement to begin expert-level discussions to design a framework for a potential nuclear agreement. At the same time, Russia's one-day ceasefire in Ukraine has also raised hopes that tensions may ease. However, these factors do not seem to have significantly boosted market confidence or weakened demand for traditional safe-haven assets.
Technical analyst interpretation:
From the 60-minute chart analysis, the recent trend of gold prices shows a clear upward channel pattern. Starting from the low of $3193.67, the price has formed a strong upward trend and has now broken through the $3370 mark, setting a record high of $3400. The MA55 moving average is at $3330.41, and the MA14 is at $3370.21. The moving average system is in a bullish arrangement, indicating that the current trend is strong. The MACD indicator shows that the DIFF value is 19.85, the DEA is 16.34, and the MACD value is 7.04. The bar chart remains above the zero axis, indicating that the short-term momentum is still upward. The RSI indicator is at 71.43, which has entered the overbought area, but there has been no obvious top divergence signal.
From the daily cycle, the gold price has started a large-scale rise since $2583.01, and has now broken through multiple psychological barriers in succession. The daily MACD indicator DIFF value is 92.15, the DEA value is 66.08, and the MACD value is 52.14. The bar chart continues to expand, indicating strong medium-term upward momentum. The RSI indicator reached a high of 76.17, which is obviously overbought. The CCI indicator is at 143.16, which is also in the overbought area, but has not yet formed an obvious top divergence pattern.
Market sentiment observation
The current market sentiment is obviously biased towards risk aversion, and gold continues to be favored as a traditional safe-haven asset. The Trump administration's "reciprocal tariff" policy has caused market concerns about the outlook for the global economy and has driven funds to safe-haven assets. Although technical indicators show that gold is overbought and the relative strength index (RSI) has reached around 75, market panic is still supporting the upward trend of gold prices.
However, it is worth noting that in the short term, the market may have a demand for profit-taking adjustments, and the accumulation of overbought signals also prompts traders to pay attention to potential technical adjustments.
Continuously release precise trading plans to lead members to expand profits, with a stable profit of 988% every month. If you have not made a profit yet, then join us. t.me/fahsufnwks
Disclaimer
The information and publications are not meant to be, and do not constitute, financial, investment, trading, or other types of advice or recommendations supplied or endorsed by TradingView. Read more in the Terms of Use.