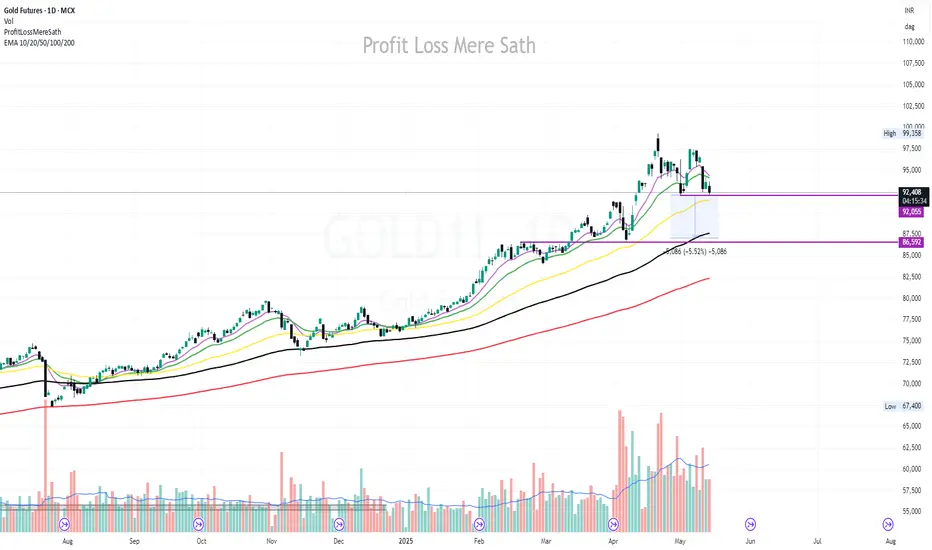
Chart Date: May 14, 2025
CMP: ₹92,558
Change: -1.16% | Volume: 14.13K
Gold has shown weakness after a strong uptrend from early February. Currently, it is consolidating near the ₹92,000 level, just above the 50 EMA (₹91,526). The price is hovering near a key support zone highlighted between ₹92,055 and ₹91,526.
📉 Key Observations:
Price rejected near recent swing high of ₹99,358.
Currently testing the 50 EMA. A breakdown below this may trigger further downside toward ₹87,500–₹86,592 demand zone.
Volume declining on recent candles – indicating weakening bullish momentum.
EMA Cluster (10/20/50) flattening out – potential trend reversal or deeper pullback in progress.
📌 Levels to Watch:
Support: ₹92,055 → ₹91,526 | Below that: ₹87,500 & ₹86,592
Resistance: ₹94,160 (20 EMA), ₹94,434 (10 EMA)
Breakdown Target Zone: ₹87,500 (5.52% from current price)
🔔 Strategy:
Wait for price action near the support zone. If breakdown confirms with volume, look for short opportunities with a tight SL above 50 EMA. Long trades only if strong reversal candles appear near ₹91.5k zone.
📊 EMA: 10/20/50/100/200 plotted for dynamic trend & support insights.
Disclaimer
The information and publications are not meant to be, and do not constitute, financial, investment, trading, or other types of advice or recommendations supplied or endorsed by TradingView. Read more in the Terms of Use.
Disclaimer
The information and publications are not meant to be, and do not constitute, financial, investment, trading, or other types of advice or recommendations supplied or endorsed by TradingView. Read more in the Terms of Use.