When it comes to trading stocks, one of the most powerful skills you can develop is the ability to spot historical bottoms, those rare moments when a stock finishes its downtrend and starts a new upward journey. Catching these bottoms means entering trades with low risk and high reward potential, riding the wave of a new trend from the very beginning.
The Power of Double Bottoms
One of the most reliable chart patterns for identifying market bottoms is the Double Bottom. This pattern acts like a springboard for price, signaling that sellers are losing control and buyers are stepping in, showing a clear floor
Here’s how it works:
First Bottom: The stock drops to a new low, but then buyers push it up.
Second Bottom: After a short rally, the price falls again, often to a similar level as the first bottom, but this time, it doesn’t go lower. Buyers step in once more.
Breakout: When the price rises above the high point between the two bottoms, it confirms the pattern and suggests a new uptrend is beginning.
This structure creates a clear “floor” in the market, showing where demand outweighs supply. Traders love this setup because it gives a logical place to set stop-losses, keeping risk low.
Learning from the Chart
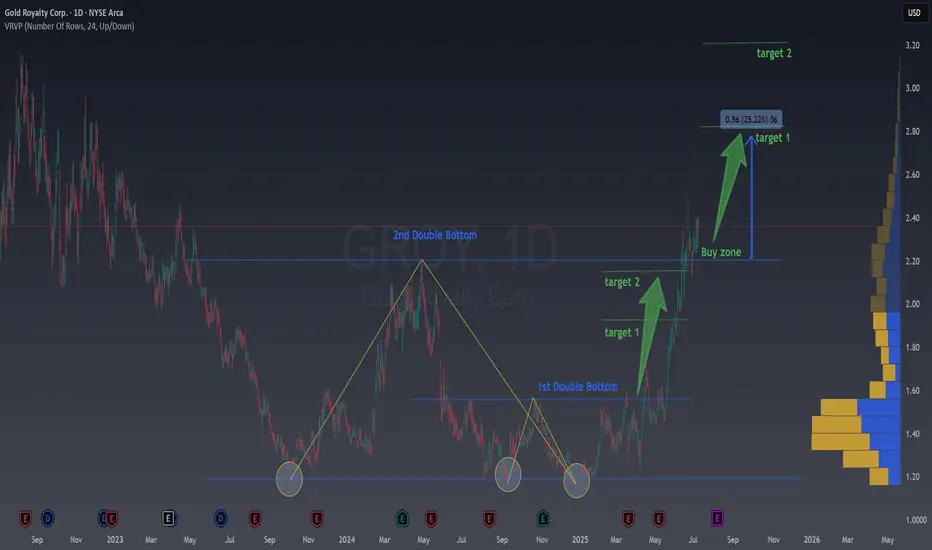
Let’s look at the provided chart of Gold Royalty Corp. (GROY) to see this in action. The chart highlights two Double Bottom patterns that formed over several months.
1st Double Bottom: Notice how the price hits a low, bounces, and then returns to the same area before bouncing again. This repeated support signals a strong bottom.
2nd Double Bottom: The pattern repeats, confirming even more buyers are entering at this level.
After these patterns form, the price breaks out above the resistance level (the high between the two bottoms). This breakout is often the ideal buy zone, the moment when a new trend is likely starting, and risk is minimized because your stop can be placed just below the recent lows.
Why Double Bottoms Work
Double Bottoms are powerful because they reflect real market psychology:
Capitulation: Sellers exhaust themselves on the first dip.
Testing: The second dip tests the market’s conviction, if buyers step in again, it’s a strong sign of a bottom.
Confirmation: The breakout above resistance confirms that demand is back in control.
How to Trade Double Bottoms
Here’s a simple, actionable approach:
Identify the Pattern: Look for two distinct lows at roughly the same price level, separated by a moderate rally.
Wait for Confirmation: Only enter when the price breaks above the high between the two bottoms.
Set Your Stop: Place your stop-loss just below some important local low or some fibo levels that we always share in our newsletter.
Target the Move: Use previous resistance levels or Fibo levels.
Example from the Chart
In the GROY chart, after the second Double Bottom, the price broke out and rallied strongly, hitting both target levels marked on the chart. Traders who entered at the breakout enjoyed a substantial move with limited downside.
Take away
Spotting Double Bottoms isn’t about predicting the future—it’s about reading the market’s story. By focusing on these patterns, you can find historical bottoms with confidence, enter trades with low risk, and position yourself to ride the next big trend. The best part? You don’t need to catch every bottom, just the clear, confirmed ones. That’s how you build consistency and success in trading.
If you’re new to chart patterns, start by looking for Double Bottoms on historical charts. Practice spotting them, and you’ll soon see how they can transform your trading approach.
The Power of Double Bottoms
One of the most reliable chart patterns for identifying market bottoms is the Double Bottom. This pattern acts like a springboard for price, signaling that sellers are losing control and buyers are stepping in, showing a clear floor
Here’s how it works:
First Bottom: The stock drops to a new low, but then buyers push it up.
Second Bottom: After a short rally, the price falls again, often to a similar level as the first bottom, but this time, it doesn’t go lower. Buyers step in once more.
Breakout: When the price rises above the high point between the two bottoms, it confirms the pattern and suggests a new uptrend is beginning.
This structure creates a clear “floor” in the market, showing where demand outweighs supply. Traders love this setup because it gives a logical place to set stop-losses, keeping risk low.
Learning from the Chart
Let’s look at the provided chart of Gold Royalty Corp. (GROY) to see this in action. The chart highlights two Double Bottom patterns that formed over several months.
1st Double Bottom: Notice how the price hits a low, bounces, and then returns to the same area before bouncing again. This repeated support signals a strong bottom.
2nd Double Bottom: The pattern repeats, confirming even more buyers are entering at this level.
After these patterns form, the price breaks out above the resistance level (the high between the two bottoms). This breakout is often the ideal buy zone, the moment when a new trend is likely starting, and risk is minimized because your stop can be placed just below the recent lows.
Why Double Bottoms Work
Double Bottoms are powerful because they reflect real market psychology:
Capitulation: Sellers exhaust themselves on the first dip.
Testing: The second dip tests the market’s conviction, if buyers step in again, it’s a strong sign of a bottom.
Confirmation: The breakout above resistance confirms that demand is back in control.
How to Trade Double Bottoms
Here’s a simple, actionable approach:
Identify the Pattern: Look for two distinct lows at roughly the same price level, separated by a moderate rally.
Wait for Confirmation: Only enter when the price breaks above the high between the two bottoms.
Set Your Stop: Place your stop-loss just below some important local low or some fibo levels that we always share in our newsletter.
Target the Move: Use previous resistance levels or Fibo levels.
Example from the Chart
In the GROY chart, after the second Double Bottom, the price broke out and rallied strongly, hitting both target levels marked on the chart. Traders who entered at the breakout enjoyed a substantial move with limited downside.
Take away
Spotting Double Bottoms isn’t about predicting the future—it’s about reading the market’s story. By focusing on these patterns, you can find historical bottoms with confidence, enter trades with low risk, and position yourself to ride the next big trend. The best part? You don’t need to catch every bottom, just the clear, confirmed ones. That’s how you build consistency and success in trading.
If you’re new to chart patterns, start by looking for Double Bottoms on historical charts. Practice spotting them, and you’ll soon see how they can transform your trading approach.
Disclaimer
The information and publications are not meant to be, and do not constitute, financial, investment, trading, or other types of advice or recommendations supplied or endorsed by TradingView. Read more in the Terms of Use.
Disclaimer
The information and publications are not meant to be, and do not constitute, financial, investment, trading, or other types of advice or recommendations supplied or endorsed by TradingView. Read more in the Terms of Use.