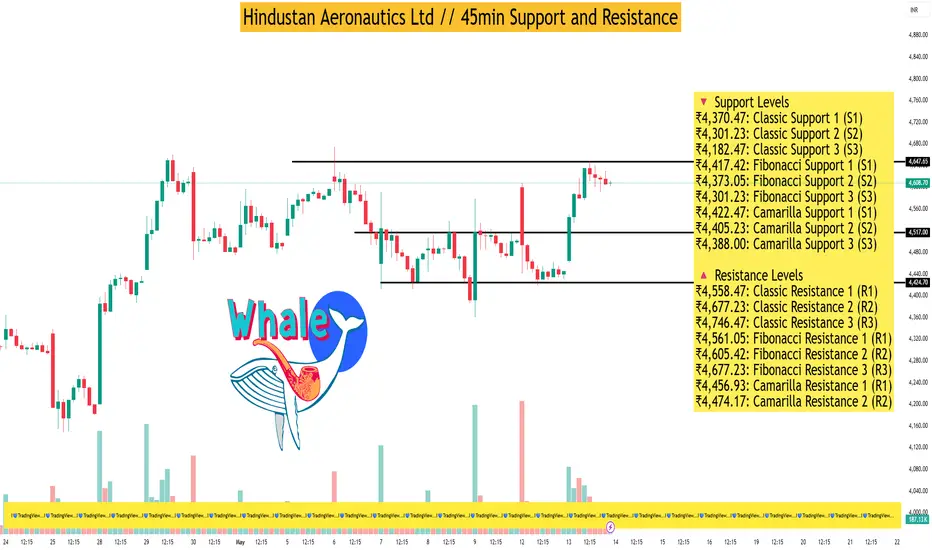
As of May 13, 2025, Hindustan Aeronautics Ltd (HAL) closed at ₹4,463.80, experiencing a slight decline of 0.668% for the day. Analyzing the 45-minute timeframe, the following support and resistance levels have been identified based on technical indicators and pivot point analyses:
🔻 Support Levels
₹4,370.47: Classic Support 1 (S1)
₹4,301.23: Classic Support 2 (S2)
₹4,182.47: Classic Support 3 (S3)
₹4,417.42: Fibonacci Support 1 (S1)
₹4,373.05: Fibonacci Support 2 (S2)
₹4,301.23: Fibonacci Support 3 (S3)
₹4,422.47: Camarilla Support 1 (S1)
₹4,405.23: Camarilla Support 2 (S2)
₹4,388.00: Camarilla Support 3 (S3)
🔺 Resistance Levels
₹4,558.47: Classic Resistance 1 (R1)
₹4,677.23: Classic Resistance 2 (R2)
₹4,746.47: Classic Resistance 3 (R3)
₹4,561.05: Fibonacci Resistance 1 (R1)
₹4,605.42: Fibonacci Resistance 2 (R2)
₹4,677.23: Fibonacci Resistance 3 (R3)
₹4,456.93: Camarilla Resistance 1 (R1)
₹4,474.17: Camarilla Resistance 2 (R2)
₹4,491.40: Camarilla Resistance 3 (R3)
📊 Technical Indicators Summary
Relative Strength Index (RSI): 44.65 – Neutral
MACD: -4.97 – Bearish
Average Directional Index (ADX): 20.58 – Indicates a weak trend
Stochastic Oscillator: 58.04 – Neutral
Rate of Change (ROC): 1.61 – Slightly bullish
Supertrend: ₹4,540.11 – Current trend indicator
Parabolic SAR (PSAR): ₹4,397.84 – Suggests potential reversal point
These indicators suggest a mildly bearish outlook in the short term, with the stock trading below key resistance levels. The RSI and Stochastic Oscillator indicate a neutral momentum, while the MACD points towards a bearish trend. The ADX value suggests that the current trend lacks strength.
Hello Guys ..
WhatsApp link- wa.link/d997q0
Email - techncialexpress@gmail.com ...
Script Coder/Trader//Investor from India. Drop a comment or DM if you have any questions! Let’s grow together!
WhatsApp link- wa.link/d997q0
Email - techncialexpress@gmail.com ...
Script Coder/Trader//Investor from India. Drop a comment or DM if you have any questions! Let’s grow together!
Related publications
Disclaimer
The information and publications are not meant to be, and do not constitute, financial, investment, trading, or other types of advice or recommendations supplied or endorsed by TradingView. Read more in the Terms of Use.