As of May 8, 2025, here are the key 4-hour support and resistance levels for HDFC Bank Ltd (NSE: HDFCBANK), based on recent technical analyses and pivot point calculations:
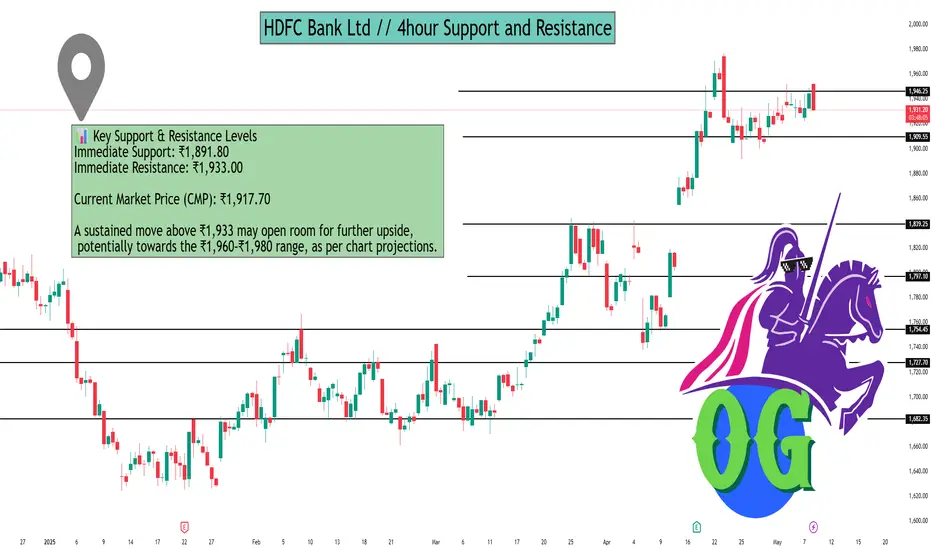
📊 Key Support & Resistance Levels
Immediate Support: ₹1,891.80
Immediate Resistance: ₹1,933.00
Current Market Price (CMP): ₹1,917.70
A sustained move above ₹1,933 may open room for further upside, potentially towards the ₹1,960–₹1,980 range, as per chart projections.
🔁 Pivot Point Levels (Daily)
Pivot Type Support Levels Resistance Levels
Classic S1: ₹1,938.90<br>S2: ₹1,929.10<br>S3: ₹1,912.60 R1: ₹1,965.20<br>R2: ₹1,981.70<br>R3: ₹1,991.50
Fibonacci S1: ₹1,938.90<br>S2: ₹1,928.85<br>S3: ₹1,912.60 R1: ₹1,955.15<br>R2: ₹1,965.20<br>R3: ₹1,981.70
Camarilla S1: ₹1,943.19<br>S2: ₹1,940.78<br>S3: ₹1,938.37 R1: ₹1,948.01<br>R2: ₹1,950.42<br>R3: ₹1,952.83
Woodie S1: ₹1,940.57<br>S2: ₹1,932.45 R1: ₹1,958.75<br>R2: ₹1,966.87
Demark S1: ₹1,934.00 R1: ₹1,960.30
📈 Technical Indicators
Relative Strength Index (RSI): 72.46 (Strong Uptrend)
Stochastic RSI: 0.92 (Strong Uptrend)
Commodity Channel Index (CCI): 130.18 (Strong Uptrend)
Money Flow Index (MFI): 86.61 (Strong Uptrend)
These indicators suggest a strong bullish momentum, indicating potential upward movement if buying interest continues.
📌 Trading Insights
Bullish Scenario: A decisive breakout above ₹1,933 could lead to a rally towards ₹1,960–₹1,980.
Bearish Scenario: If the price falls below ₹1,891.80, it may test lower support levels around ₹1,870.69.
Neutral Zone: The area between ₹1,891.80 and ₹1,933 is critical; price action within this range may indicate consolidation before the next significant move.
Hello Guys ..
WhatsApp link- wa.link/d997q0
Email - techncialexpress@gmail.com ...
Script Coder/Trader//Investor from India. Drop a comment or DM if you have any questions! Let’s grow together!
WhatsApp link- wa.link/d997q0
Email - techncialexpress@gmail.com ...
Script Coder/Trader//Investor from India. Drop a comment or DM if you have any questions! Let’s grow together!
Related publications
Disclaimer
The information and publications are not meant to be, and do not constitute, financial, investment, trading, or other types of advice or recommendations supplied or endorsed by TradingView. Read more in the Terms of Use.