As of May 30, 2025, here are the 30-minute interval support and resistance levels for HDFC Bank Ltd (NSE: HDFCBANK), based on the latest available data:
📊 Current Price Snapshot
Last Traded Price: ₹1,944.90
Day’s Range: ₹1,925.10 – ₹1,948.60
52-Week Range: ₹1,490.00 – ₹1,978.90
Market Capitalization: ₹14.77 trillion
Beta: 0.77
Volatility: 1.22%
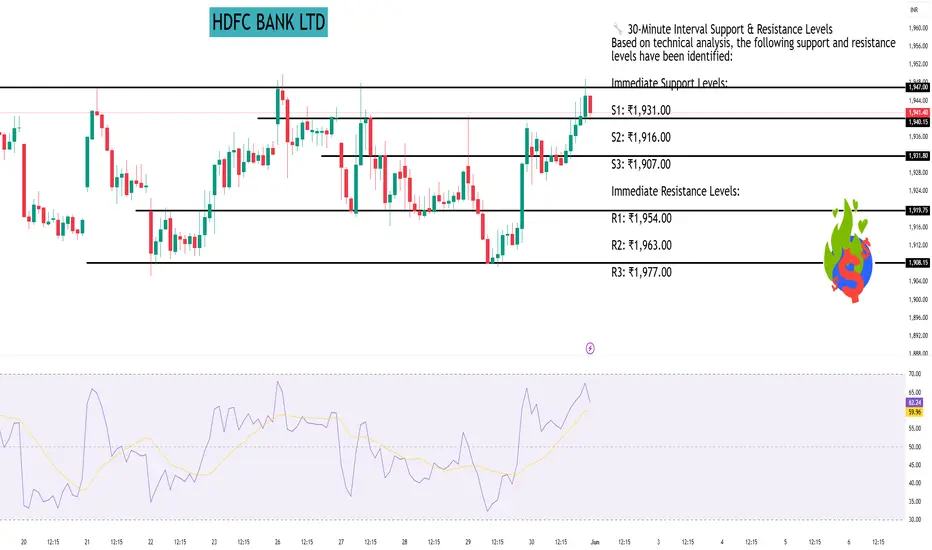
🔧 30-Minute Interval Support & Resistance Levels
Based on technical analysis, the following support and resistance levels have been identified:
Immediate Support Levels:
S1: ₹1,931.00
S2: ₹1,916.00
S3: ₹1,907.00
Immediate Resistance Levels:
R1: ₹1,954.00
R2: ₹1,963.00
R3: ₹1,977.00
📈 Technical Indicators Summary
Relative Strength Index (RSI): 55.32 (Neutral)
MACD: 0.333 (Bullish)
ADX: 16.63 (Indicates a weak trend)
Stochastic RSI: 55.28 (Neutral)
Supertrend: ₹384.44 (Bullish)
Parabolic SAR (PSAR): ₹385.89 (Bullish)
🧭 Trading Outlook
Trend: Neutral to Slightly Bullish
Recommendation: The stock is trading near its immediate resistance level of ₹1,954.00. A breakout above this level could indicate a bullish trend, while a drop below the immediate support of ₹1,931.00 might suggest bearish momentum. Traders should monitor these levels closely for potential entry or exit points.
📊 Current Price Snapshot
Last Traded Price: ₹1,944.90
Day’s Range: ₹1,925.10 – ₹1,948.60
52-Week Range: ₹1,490.00 – ₹1,978.90
Market Capitalization: ₹14.77 trillion
Beta: 0.77
Volatility: 1.22%
🔧 30-Minute Interval Support & Resistance Levels
Based on technical analysis, the following support and resistance levels have been identified:
Immediate Support Levels:
S1: ₹1,931.00
S2: ₹1,916.00
S3: ₹1,907.00
Immediate Resistance Levels:
R1: ₹1,954.00
R2: ₹1,963.00
R3: ₹1,977.00
📈 Technical Indicators Summary
Relative Strength Index (RSI): 55.32 (Neutral)
MACD: 0.333 (Bullish)
ADX: 16.63 (Indicates a weak trend)
Stochastic RSI: 55.28 (Neutral)
Supertrend: ₹384.44 (Bullish)
Parabolic SAR (PSAR): ₹385.89 (Bullish)
🧭 Trading Outlook
Trend: Neutral to Slightly Bullish
Recommendation: The stock is trading near its immediate resistance level of ₹1,954.00. A breakout above this level could indicate a bullish trend, while a drop below the immediate support of ₹1,931.00 might suggest bearish momentum. Traders should monitor these levels closely for potential entry or exit points.
Hello Guys ..
WhatsApp link- wa.link/d997q0
Email - techncialexpress@gmail.com ...
Script Coder/Trader//Investor from India. Drop a comment or DM if you have any questions! Let’s grow together!
WhatsApp link- wa.link/d997q0
Email - techncialexpress@gmail.com ...
Script Coder/Trader//Investor from India. Drop a comment or DM if you have any questions! Let’s grow together!
Related publications
Disclaimer
The information and publications are not meant to be, and do not constitute, financial, investment, trading, or other types of advice or recommendations supplied or endorsed by TradingView. Read more in the Terms of Use.