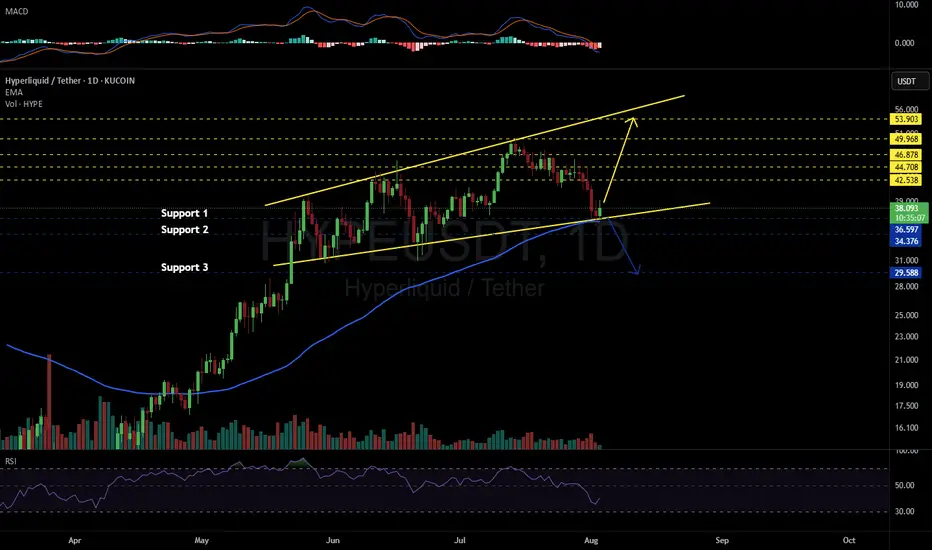
#HYPE is moving inside an Ascending Broadening Wedge pattern on the daily chart — a structure that typically carries a bearish bias.
However, for now, #HYPE has bounced from the wedge support line and the daily EMA100, suggesting a possible short-term move to the upside.
If momentum continues, potential targets are:
🎯 $42.538
🎯 $44.708
🎯 $46.878
🎯 $49.968
🎯 $53.903
📉 On the other hand, if price breaks below the pattern, the daily EMA100, and the $36.597 support, deeper correction could follow toward:
🔻 $34.376
🔻 $29.588
⚠️ As always, use a tight stop-loss and apply proper risk management.
Disclaimer
The information and publications are not meant to be, and do not constitute, financial, investment, trading, or other types of advice or recommendations supplied or endorsed by TradingView. Read more in the Terms of Use.
Disclaimer
The information and publications are not meant to be, and do not constitute, financial, investment, trading, or other types of advice or recommendations supplied or endorsed by TradingView. Read more in the Terms of Use.