Long
INOX LEUSURE
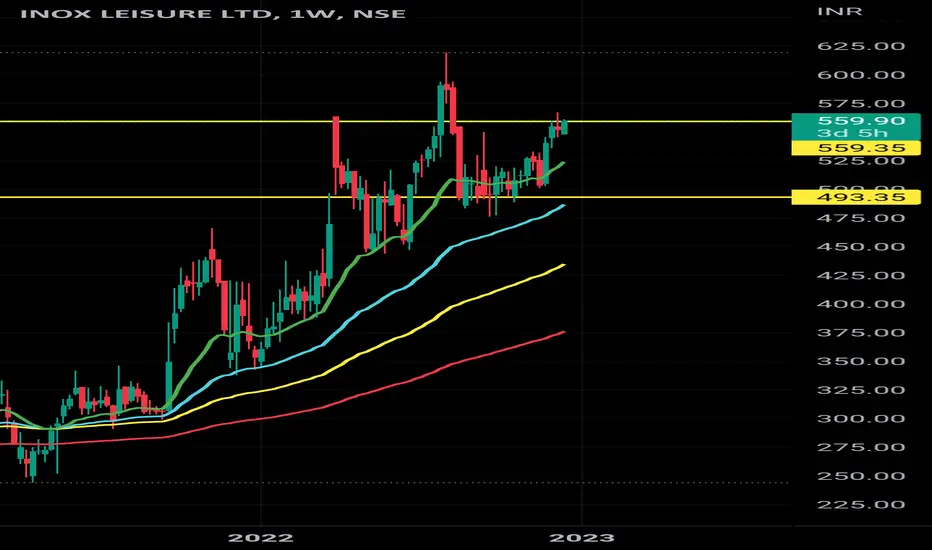
Stock on the weekly chart has given a bullish rectangle pattern breakout and prices are trading above its trend line resistance.
Post breakout prices are consolidating above its trendline and sustain above its 21 – day exponential moving average. The momentum oscillator RSI (14) is reading above 60 levels and has given breakout above its trend line resistance.
The resistance for the stock is placed at 580 levels and support for the current pattern is placed at 535 levels.
Disclaimer
The information and publications are not meant to be, and do not constitute, financial, investment, trading, or other types of advice or recommendations supplied or endorsed by TradingView. Read more in the Terms of Use.
Disclaimer
The information and publications are not meant to be, and do not constitute, financial, investment, trading, or other types of advice or recommendations supplied or endorsed by TradingView. Read more in the Terms of Use.