Scalping Analysis for IWM:
1. Support and Resistance Levels:
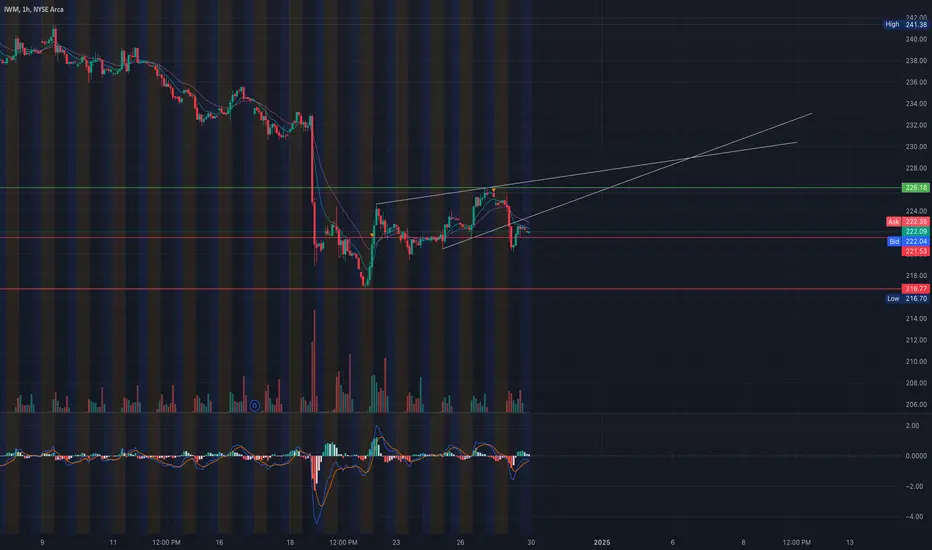
* Immediate support near $221 (put wall and HVL).
* Resistance at $226 (gamma resistance and call wall).
2. Key Indicators:
* 9 EMA & 21 EMA: Price is testing the EMAs on the hourly timeframe. A rejection here could lead to further downside, while a breakout suggests a bullish move.
* MACD: Currently neutral with a potential bullish crossover. Wait for confirmation.
3. Scalping Plan:
* Bearish Scenario:
* Entry: On rejection near $224-$226.
* Target: $221, $218.
* Stop Loss: Above $227.
* Bullish Scenario:
* Entry: Breakout above $226 with volume confirmation.
* Target: $227, $232.
* Stop Loss: Below $224.
Swing/Day Trading Analysis for IWM:
1. Trendlines:
* IWM is forming a consolidation zone. A breakout above $226 or breakdown below $221 will provide a clear directional move.
2. GEX Analysis:
* Strong resistance at $226-$227 (gamma resistance and call wall).
* Solid support at $221 (HVL) and $218 (put wall).
3. Trade Scenarios:
* Bullish Swing:
* Entry: Above $226 with strong volume or on a pullback to $221 with support confirmation.
* Target: $232, $236.
* Stop Loss: Below $224.
* Bearish Swing:
* Entry: Below $221 on breakdown confirmation.
* Target: $218, $215.
* Stop Loss: Above $223.

Options Play with GEX Insights:
1. High GEX Areas:
* Call Wall: $226, $227.
* Put Wall: $221, $218.
2. Suggested Options Strategy:
* Bullish Play:
* Buy Jan 5th $226 Call if IWM breaks above $226 with volume.
* Target: Move toward $227-$232.
* Risk: Below $224.
* Bearish Play:
* Buy Jan 5th $220 Put if IWM breaks below $221.
* Target: $218-$215.
* Risk: Above $223.
3. Options Oscillator Metrics:
* IVR (20.7%) suggests moderately priced premiums for options strategies.
* Low GEX (1.8%) implies limited gamma influence but still highlights significant zones at $226 (resistance) and $221 (support).
Insights:
* IWM is trading near a pivotal level at $221, with significant resistance overhead at $226. A clear breakout or breakdown from this range will define the next move.
* Volume Confirmation: Watch for a surge in volume near $221 or $226 to confirm directional bias.
Disclaimer: This analysis is for educational purposes only and does not constitute financial advice. Always trade responsibly and manage risk.
1. Support and Resistance Levels:
* Immediate support near $221 (put wall and HVL).
* Resistance at $226 (gamma resistance and call wall).
2. Key Indicators:
* 9 EMA & 21 EMA: Price is testing the EMAs on the hourly timeframe. A rejection here could lead to further downside, while a breakout suggests a bullish move.
* MACD: Currently neutral with a potential bullish crossover. Wait for confirmation.
3. Scalping Plan:
* Bearish Scenario:
* Entry: On rejection near $224-$226.
* Target: $221, $218.
* Stop Loss: Above $227.
* Bullish Scenario:
* Entry: Breakout above $226 with volume confirmation.
* Target: $227, $232.
* Stop Loss: Below $224.
Swing/Day Trading Analysis for IWM:
1. Trendlines:
* IWM is forming a consolidation zone. A breakout above $226 or breakdown below $221 will provide a clear directional move.
2. GEX Analysis:
* Strong resistance at $226-$227 (gamma resistance and call wall).
* Solid support at $221 (HVL) and $218 (put wall).
3. Trade Scenarios:
* Bullish Swing:
* Entry: Above $226 with strong volume or on a pullback to $221 with support confirmation.
* Target: $232, $236.
* Stop Loss: Below $224.
* Bearish Swing:
* Entry: Below $221 on breakdown confirmation.
* Target: $218, $215.
* Stop Loss: Above $223.
Options Play with GEX Insights:
1. High GEX Areas:
* Call Wall: $226, $227.
* Put Wall: $221, $218.
2. Suggested Options Strategy:
* Bullish Play:
* Buy Jan 5th $226 Call if IWM breaks above $226 with volume.
* Target: Move toward $227-$232.
* Risk: Below $224.
* Bearish Play:
* Buy Jan 5th $220 Put if IWM breaks below $221.
* Target: $218-$215.
* Risk: Above $223.
3. Options Oscillator Metrics:
* IVR (20.7%) suggests moderately priced premiums for options strategies.
* Low GEX (1.8%) implies limited gamma influence but still highlights significant zones at $226 (resistance) and $221 (support).
Insights:
* IWM is trading near a pivotal level at $221, with significant resistance overhead at $226. A clear breakout or breakdown from this range will define the next move.
* Volume Confirmation: Watch for a surge in volume near $221 or $226 to confirm directional bias.
Disclaimer: This analysis is for educational purposes only and does not constitute financial advice. Always trade responsibly and manage risk.
Disclaimer
The information and publications are not meant to be, and do not constitute, financial, investment, trading, or other types of advice or recommendations supplied or endorsed by TradingView. Read more in the Terms of Use.
Disclaimer
The information and publications are not meant to be, and do not constitute, financial, investment, trading, or other types of advice or recommendations supplied or endorsed by TradingView. Read more in the Terms of Use.