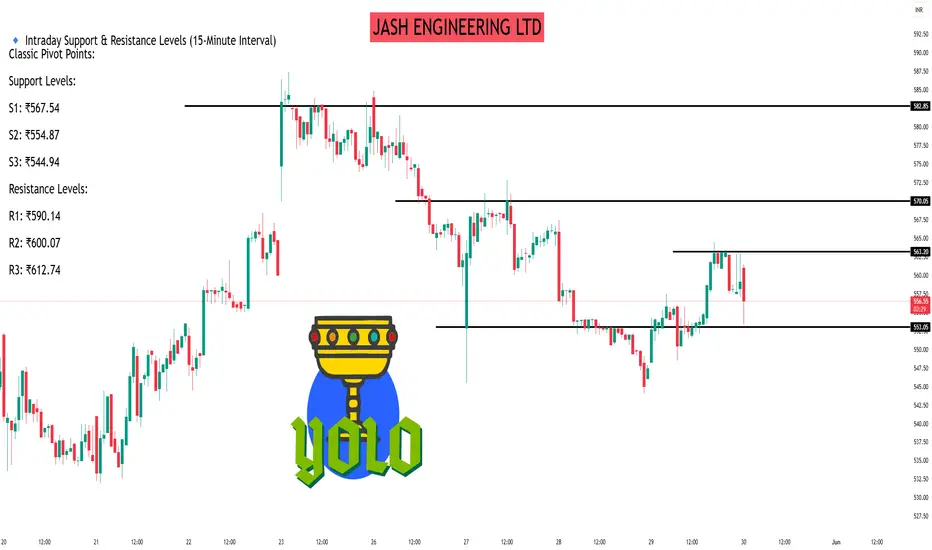
As of May 30, 2025, Jash Engineering Ltd. (NSE: JASH) is trading at approximately ₹559.40. Based on recent technical analyses, here are the 15-minute intraday support and resistance levels:
🔹 Intraday Support & Resistance Levels (15-Minute Interval)
Classic Pivot Points:
Support Levels:
S1: ₹567.54
S2: ₹554.87
S3: ₹544.94
Resistance Levels:
R1: ₹590.14
R2: ₹600.07
R3: ₹612.74
Fibonacci Pivot Points:
Support Levels:
S1: ₹568.84
S2: ₹563.50
S3: ₹554.87
Resistance Levels:
R1: ₹586.10
R2: ₹591.44
R3: ₹600.07
Camarilla Pivot Points:
Support Levels:
S1: ₹578.13
S2: ₹576.06
S3: ₹573.99
Resistance Levels:
R1: ₹582.27
R2: ₹584.34
R3: ₹586.42
Note: These levels are derived from pivot point calculations and can vary based on market conditions.
📊 Technical Indicators
Moving Averages: The stock is currently below both short-term and long-term moving averages, indicating a bearish trend.
MACD: A bullish crossover has been observed, suggesting potential upward momentum.
RSI: The Relative Strength Index is in the neutral zone, indicating neither overbought nor oversold conditions.
🔍 Observations
The stock has recently tested the support level around ₹539.50, which may act as a strong base.
Resistance is observed near ₹554.05, and a breakout above this level could signal further upside.
The stock's volatility is moderate, with a daily average movement of approximately 4.39%.
Hello Guys ..
WhatsApp link- wa.link/d997q0
Email - techncialexpress@gmail.com ...
Script Coder/Trader//Investor from India. Drop a comment or DM if you have any questions! Let’s grow together!
WhatsApp link- wa.link/d997q0
Email - techncialexpress@gmail.com ...
Script Coder/Trader//Investor from India. Drop a comment or DM if you have any questions! Let’s grow together!
Related publications
Disclaimer
The information and publications are not meant to be, and do not constitute, financial, investment, trading, or other types of advice or recommendations supplied or endorsed by TradingView. Read more in the Terms of Use.