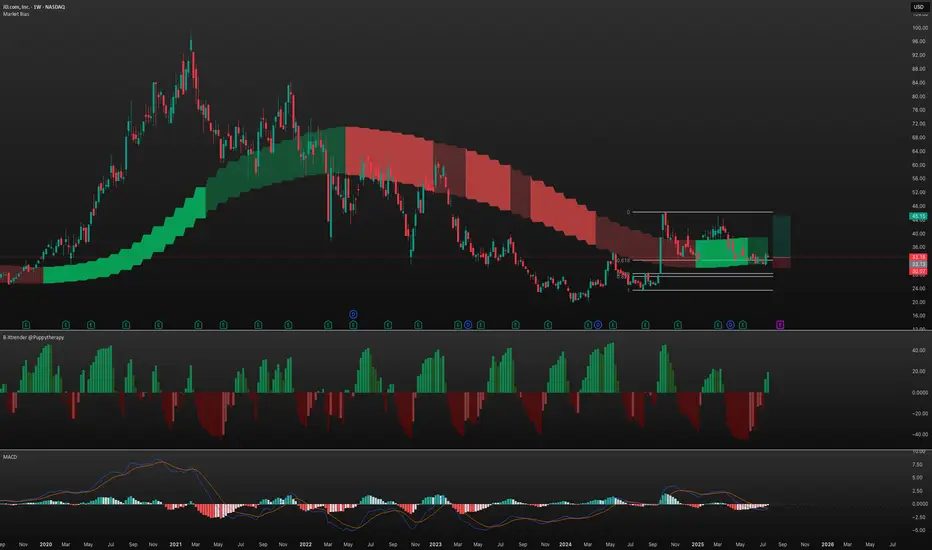
Step 1: Identify the Trend
* Weekly Chart:
* Dark green, price still in the market bias zone (discount zone).
* Bullish trend but not actively expanding yet.
* Daily Chart:
* Dark red, price below the market bias zone.
* Bearish trend but not actively contracting.
Step 2: Identify the Mode
* Compression: April 25 – mid-July 2025.
* Breakout: JD closed above the recent high on July 18, indicating early expansion.
Step 3: Confirm Bullish Accumulation (BX Trender)
* Weekly Chart: Bullish accumulation confirmed, with higher highs since week of July 14.
* Daily Chart: Use for entry timing and share accumulation.
Step 4: Entry Zones
* Institutional Buy Zone: $28.5 – $32.0 (Fib retracement from swing low to high).
* Smart Money Zone: $27.5 – $28.4 (deeper liquidity zone).
Step 5: Take Profit
* 1st Target: 50% at $45(EQ high).
* 2nd Target: Let the rest ride until BX turns red.
* Point of Control (POC): Around $34.
Step 6: Stop Loss
* Below Monthly Market Bias: Around $30 (conservative protection).
JD Trade Setup
* Entry: $28.5 – $32.0
* Stop: ~$30
* 1st TP: $45
* 2nd TP: Trail with BX trender
* Bias: Bullish accumulation phase; early expansion signal confirmed.
Disclaimer: The information provided is for informational and educational purposes only and should not be considered financial advice. Always conduct your own research or consult with a licensed financial advisor before making any investment decisions.
Note
please feel free to comment, let me know what you think or if you notice any mistakes or errors.Disclaimer
The information and publications are not meant to be, and do not constitute, financial, investment, trading, or other types of advice or recommendations supplied or endorsed by TradingView. Read more in the Terms of Use.
Disclaimer
The information and publications are not meant to be, and do not constitute, financial, investment, trading, or other types of advice or recommendations supplied or endorsed by TradingView. Read more in the Terms of Use.
