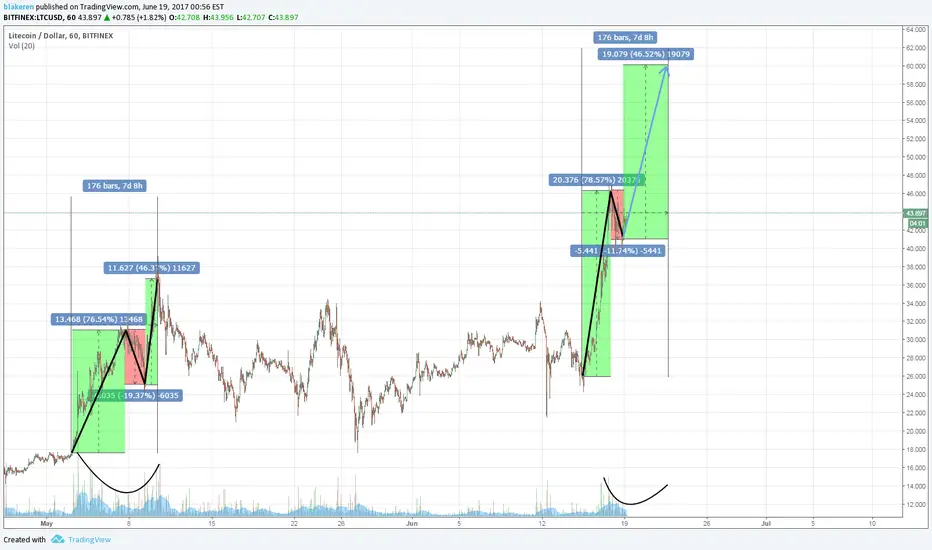
Massive bull trend of around 75%, followed by a 10-20% downward trend. Back in May we ended up with a bull run of almost 50%, looking like it could do that again and head towards $60. This whole process to roughly 1 week to complete last time, so if this follows suit, we're looking at a 40% ($20) bull run for the next 4 days. Volume also looks very similar to events back in May
Just starting out with graph analysis so do NOT take any of this as financial/investment advice. Any feedback would be much appreciated :)
Just starting out with graph analysis so do NOT take any of this as financial/investment advice. Any feedback would be much appreciated :)
Disclaimer
The information and publications are not meant to be, and do not constitute, financial, investment, trading, or other types of advice or recommendations supplied or endorsed by TradingView. Read more in the Terms of Use.
Disclaimer
The information and publications are not meant to be, and do not constitute, financial, investment, trading, or other types of advice or recommendations supplied or endorsed by TradingView. Read more in the Terms of Use.
