Key Support and Resistance Levels
Support Zones:
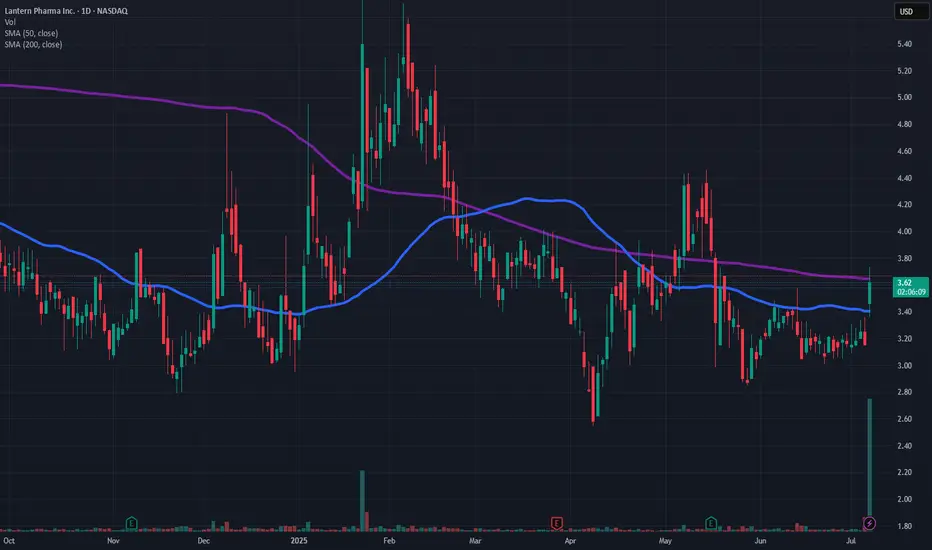
Around $3.00: Multiple bounces have occurred here since April.
Lower support near $2.80, which was briefly tested in May.
Resistance Zones:
Immediate resistance at $3.64 (200-day SMA).
Previous resistance zone around $4.00–$4.20 seen in May and February.
Strong resistance around $5.00+, which acted as a top in January and February.
Momentum Indicators
1. Moving Averages (50 & 200 SMA)
50-day SMA (Blue): Currently at $3.40 and was recently crossed to the upside — a short-term bullish sign.
200-day SMA (Purple): Currently at $3.64 — still above the price, which means the long-term trend is bearish but approaching a critical test.
A golden cross (50 SMA crossing above 200 SMA) has not yet occurred but is something to watch for.
2. Volume
A significant spike in volume on the latest green candle indicates strong buying interest and could support further upside momentum.
3. RSI (Relative Strength Index)
Note: The RSI is not directly shown on this chart, but based on the sharp move, it is likely approaching or slightly over 70, indicating overbought conditions in the short term.
4. MACD (Moving Average Convergence Divergence)
MACD is not visible in the image, but based on the crossover of the 50 SMA and recent price surge, it is likely turning positive or has just crossed above the signal line, indicating bullish momentum.
Conclusion:
Current Market Sentiment
Short-term: Bullish
Strong volume surge
Price broke above the 50 SMA
Potential test of the 200 SMA
Medium-term: Neutral to cautiously bullish
Needs to break and hold above the $3.64–$4.00 zone
Long-term: Bearish to neutral
Still below the 200 SMA
Trend remains sideways until a definitive break above long-term resistance
Key Watch Areas
A break and close above the 200-day SMA ($3.64) would signal a stronger bullish reversal.
Failure to hold above $3.40 (50 SMA) could lead to a pullback toward $3.00 support.
Watch RSI to gauge whether the move becomes overextended in the short term.
Support Zones:
Around $3.00: Multiple bounces have occurred here since April.
Lower support near $2.80, which was briefly tested in May.
Resistance Zones:
Immediate resistance at $3.64 (200-day SMA).
Previous resistance zone around $4.00–$4.20 seen in May and February.
Strong resistance around $5.00+, which acted as a top in January and February.
Momentum Indicators
1. Moving Averages (50 & 200 SMA)
50-day SMA (Blue): Currently at $3.40 and was recently crossed to the upside — a short-term bullish sign.
200-day SMA (Purple): Currently at $3.64 — still above the price, which means the long-term trend is bearish but approaching a critical test.
A golden cross (50 SMA crossing above 200 SMA) has not yet occurred but is something to watch for.
2. Volume
A significant spike in volume on the latest green candle indicates strong buying interest and could support further upside momentum.
3. RSI (Relative Strength Index)
Note: The RSI is not directly shown on this chart, but based on the sharp move, it is likely approaching or slightly over 70, indicating overbought conditions in the short term.
4. MACD (Moving Average Convergence Divergence)
MACD is not visible in the image, but based on the crossover of the 50 SMA and recent price surge, it is likely turning positive or has just crossed above the signal line, indicating bullish momentum.
Conclusion:
Current Market Sentiment
Short-term: Bullish
Strong volume surge
Price broke above the 50 SMA
Potential test of the 200 SMA
Medium-term: Neutral to cautiously bullish
Needs to break and hold above the $3.64–$4.00 zone
Long-term: Bearish to neutral
Still below the 200 SMA
Trend remains sideways until a definitive break above long-term resistance
Key Watch Areas
A break and close above the 200-day SMA ($3.64) would signal a stronger bullish reversal.
Failure to hold above $3.40 (50 SMA) could lead to a pullback toward $3.00 support.
Watch RSI to gauge whether the move becomes overextended in the short term.
Disclaimer
The information and publications are not meant to be, and do not constitute, financial, investment, trading, or other types of advice or recommendations supplied or endorsed by TradingView. Read more in the Terms of Use.
Disclaimer
The information and publications are not meant to be, and do not constitute, financial, investment, trading, or other types of advice or recommendations supplied or endorsed by TradingView. Read more in the Terms of Use.