MAZAGON DOCK SHIPBUIL LTD
Technical Analysis & Breakout Insights
Mazagon Dock Shipbuilders Ltd. - Technical Analysis & Breakout Insights
Date: May 16, 2025
Exchange: NSE
Current Market Price (CMP): 3,522.40
% Change: +10.68% | Volume: 16.56M
Price Action Summary
Mazagon Dock witnessed a powerful bullish rally with a close near the day's high, registering a 10.68% gain on extremely high volume. This signals a high-conviction breakout above previous resistances, with the stock clocking a fresh 52-week high and exhibiting signs of strong institutional participation.
Chart Pattern & Indicator Insights
20-Day Volume Breakout: Volume (16.56M) > 2x 20-day avg (6.7M) - strong accumulation.
52-Week High: Breaks annual high - bullish continuation signal.
Multi-Breakout Confluence: RSI, Bollinger Band breakout & BB squeeze-off- confirms explosive momentum.
Strong Bullish Candle: Big green candle closing near high - aggressive buying, minimal profit booking.
Bullish Momentum Cluster
Strong bullish momentum with RSI breakout
Swing trade candidate with intraday & short-term potential
Bollinger Band breakout + BB squeeze-off
Ideal for buy today, sell tomorrow setup
High probability trend continuation
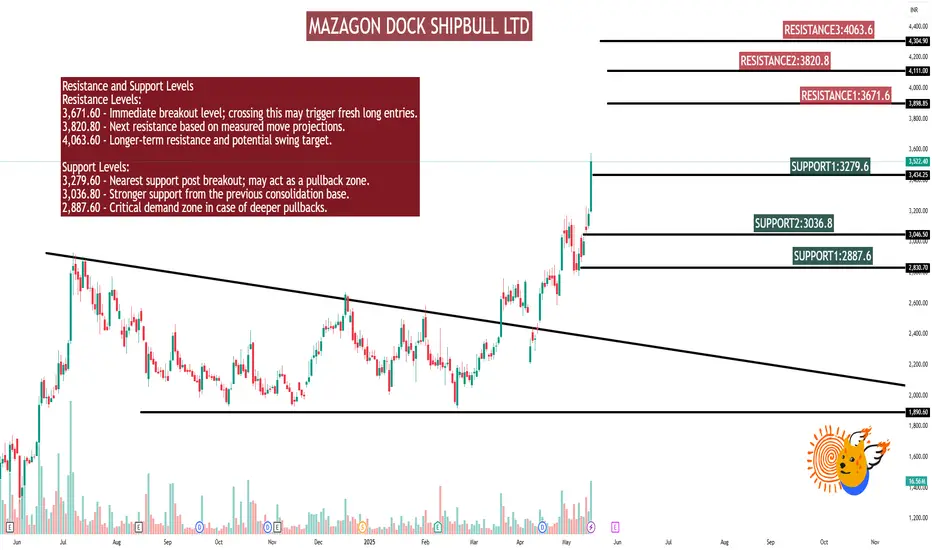
Resistance and Support Levels
Resistance Levels:
3,671.60 - Immediate breakout level; crossing this may trigger fresh long entries.
3,820.80 - Next resistance based on measured move projections.
4,063.60 - Longer-term resistance and potential swing target.
Support Levels:
3,279.60 - Nearest support post breakout; may act as a pullback zone.
3,036.80 - Stronger support from the previous consolidation base.
2,887.60 - Critical demand zone in case of deeper pullbacks.
Educational Insights: How to Trade Mazagon Dock
Between July 2023 and March 2025, the stock was in a descending triangle or a contracting range, forming lower highs (red descending trendline) and finding support around 1920 levels (horizontal red line). This shows accumulation or consolidation after a strong uptrend.
Inside the range, a W-shaped structure (marked in blue) is visible. This is often a bullish reversal pattern, especially when it breaks out with strong volume, which happened around March-April 2025. A decisive breakout above the descending resistance trendline occurred with a spike in volume. Price has since rallied from around 3200 levels to the levels of 3500 (+10.68% today), indicating strong bullish momentum.
Volume Analysis: Notice the huge green volume bar on the breakout day (May 16, 2025), indicating strong buying interest and institutional participation. Volume buildup had already started increasing in late April, supporting the breakout.
Technical Observations: The stock shows signs of a strong uptrend following a breakout from a long-term consolidation zone. Based on previous price structure, the 2,600-2,400 range may act as a potential support area, where price had earlier faced resistance.
Technical Analysis & Breakout Insights
Mazagon Dock Shipbuilders Ltd. - Technical Analysis & Breakout Insights
Date: May 16, 2025
Exchange: NSE
Current Market Price (CMP): 3,522.40
% Change: +10.68% | Volume: 16.56M
Price Action Summary
Mazagon Dock witnessed a powerful bullish rally with a close near the day's high, registering a 10.68% gain on extremely high volume. This signals a high-conviction breakout above previous resistances, with the stock clocking a fresh 52-week high and exhibiting signs of strong institutional participation.
Chart Pattern & Indicator Insights
20-Day Volume Breakout: Volume (16.56M) > 2x 20-day avg (6.7M) - strong accumulation.
52-Week High: Breaks annual high - bullish continuation signal.
Multi-Breakout Confluence: RSI, Bollinger Band breakout & BB squeeze-off- confirms explosive momentum.
Strong Bullish Candle: Big green candle closing near high - aggressive buying, minimal profit booking.
Bullish Momentum Cluster
Strong bullish momentum with RSI breakout
Swing trade candidate with intraday & short-term potential
Bollinger Band breakout + BB squeeze-off
Ideal for buy today, sell tomorrow setup
High probability trend continuation
Resistance and Support Levels
Resistance Levels:
3,671.60 - Immediate breakout level; crossing this may trigger fresh long entries.
3,820.80 - Next resistance based on measured move projections.
4,063.60 - Longer-term resistance and potential swing target.
Support Levels:
3,279.60 - Nearest support post breakout; may act as a pullback zone.
3,036.80 - Stronger support from the previous consolidation base.
2,887.60 - Critical demand zone in case of deeper pullbacks.
Educational Insights: How to Trade Mazagon Dock
Between July 2023 and March 2025, the stock was in a descending triangle or a contracting range, forming lower highs (red descending trendline) and finding support around 1920 levels (horizontal red line). This shows accumulation or consolidation after a strong uptrend.
Inside the range, a W-shaped structure (marked in blue) is visible. This is often a bullish reversal pattern, especially when it breaks out with strong volume, which happened around March-April 2025. A decisive breakout above the descending resistance trendline occurred with a spike in volume. Price has since rallied from around 3200 levels to the levels of 3500 (+10.68% today), indicating strong bullish momentum.
Volume Analysis: Notice the huge green volume bar on the breakout day (May 16, 2025), indicating strong buying interest and institutional participation. Volume buildup had already started increasing in late April, supporting the breakout.
Technical Observations: The stock shows signs of a strong uptrend following a breakout from a long-term consolidation zone. Based on previous price structure, the 2,600-2,400 range may act as a potential support area, where price had earlier faced resistance.
Hello Guys ..
WhatsApp link- wa.link/d997q0
Email - techncialexpress@gmail.com ...
Script Coder/Trader//Investor from India. Drop a comment or DM if you have any questions! Let’s grow together!
WhatsApp link- wa.link/d997q0
Email - techncialexpress@gmail.com ...
Script Coder/Trader//Investor from India. Drop a comment or DM if you have any questions! Let’s grow together!
Related publications
Disclaimer
The information and publications are not meant to be, and do not constitute, financial, investment, trading, or other types of advice or recommendations supplied or endorsed by TradingView. Read more in the Terms of Use.