Chart Analysis:
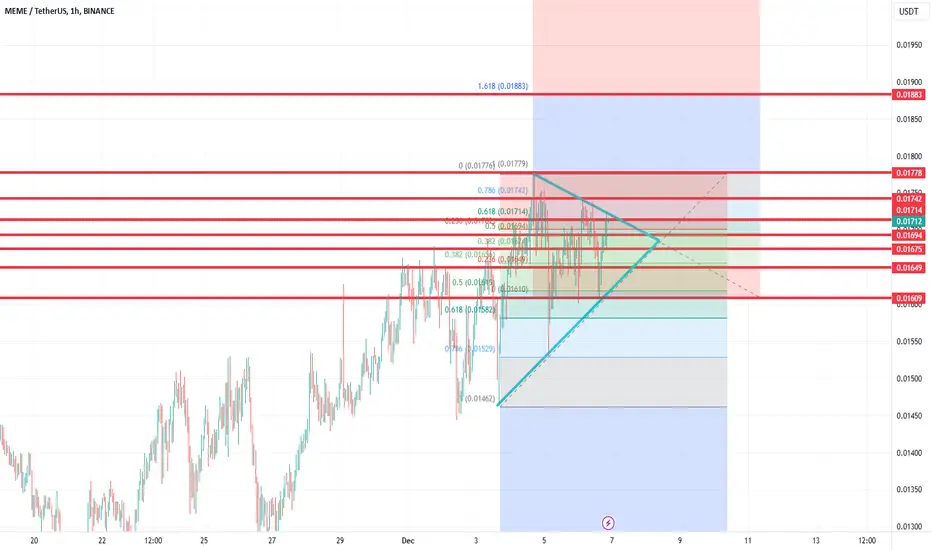
The chart shows the MEME/USDT pair and presents a price analysis on an hourly timeframe.
Fibonacci retracement levels have been applied, marking key resistance/support levels:
Important levels: 0.382 (0.0165), 0.5 (0.0161), 0.618 (0.0174), etc.
The blue lines indicate a triangle pattern in which the price is consolidating. This typically suggests a breakout is imminent.
The 1.618 level (0.01883) is marked as a potential future target.
Trend and Performance:
At the bottom-right corner, performance percentages are visible: the price has shown a +2.7% increase.
The trading volume (1.07B) is slightly below average, suggesting that the market hasn’t made a significant move yet.
Visual Details:
The desktop features a wolf image, creating a striking aesthetic focus.
On the left, trading platforms and browsers are visible, suggesting active involvement in crypto trading.
Disclaimer
The information and publications are not meant to be, and do not constitute, financial, investment, trading, or other types of advice or recommendations supplied or endorsed by TradingView. Read more in the Terms of Use.
Disclaimer
The information and publications are not meant to be, and do not constitute, financial, investment, trading, or other types of advice or recommendations supplied or endorsed by TradingView. Read more in the Terms of Use.