Moodeng has experienced a sharp 13.81% correction following a strong rally that pushed price action to local highs over the weekend. This recent drop, while significant, is technically healthy and expected after such a volatile move upward.
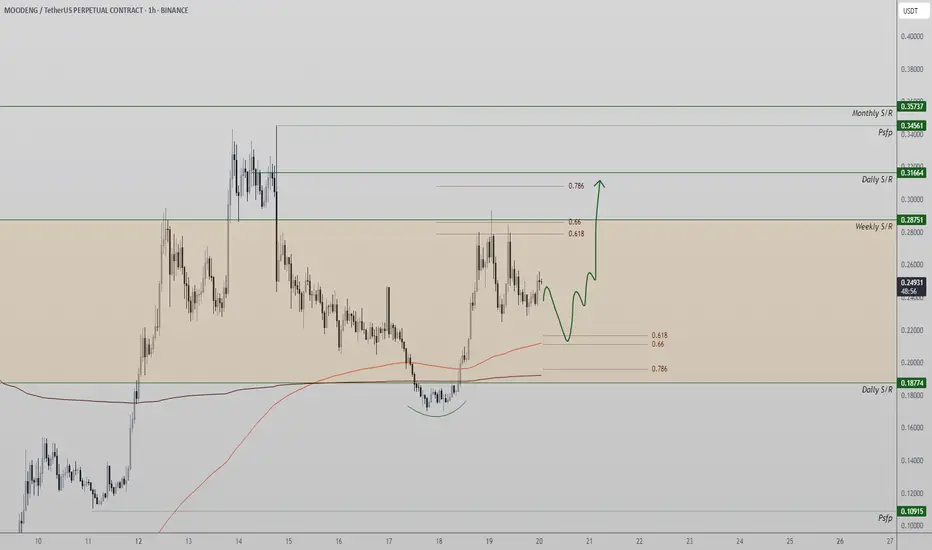
The rejection stems from price testing a key resistance zone, which aligns with the 0.618 Fibonacci level — a common reversal point during trending markets. From a price action perspective, this is classified as bullish selling, where the market temporarily cools off before resuming the uptrend.
Currently, Moodeng is approaching a highly significant support area near $0.21. This region acts as a high-probability trade zone as it converges with several critical technical factors: the 0.618 Fibonacci level, the 200-day moving average, and a major daily support zone. If price holds here, it’s likely we’ll see a higher low form, which would confirm continued bullish structure.
The market structure remains bullish with a consistent pattern of higher highs and higher lows. Holding this support zone will validate the bullish trend and increase the likelihood of price retesting key resistance levels — first at $0.31 and potentially up to $0.35.
In summary, the 13.81% drop is not a trend reversal, but rather a corrective phase within an ongoing bullish cycle. If support holds and price begins to rotate higher from this confluence zone, Moodeng could soon resume its upward trajectory with strong momentum. Keep a close eye on how price behaves around the $0.21 level — it’s a make-or-break zone that could define the next big move.
Join the Free Trading Group
Telegram: t.me/freetradingden 🔥
Unlock Blofin Bonuses
Trade with perks & support the community!
blofin.com/invite/alchemisttrader 🎁
Stay sharp, trade smart.
— Team The Alchemist ⚔️
Telegram: t.me/freetradingden 🔥
Unlock Blofin Bonuses
Trade with perks & support the community!
blofin.com/invite/alchemisttrader 🎁
Stay sharp, trade smart.
— Team The Alchemist ⚔️
Disclaimer
The information and publications are not meant to be, and do not constitute, financial, investment, trading, or other types of advice or recommendations supplied or endorsed by TradingView. Read more in the Terms of Use.