The breakdown of the tools and target used in your NAS100 (US Tech 100) 2h chart:
*Tools Used:*
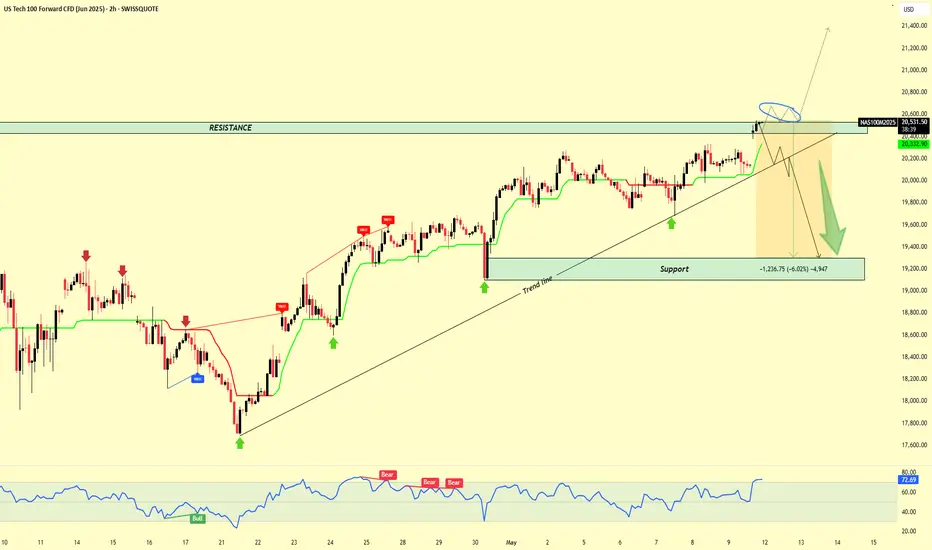
1. *Support & Resistance Zones:*
*Resistance Zone:* Highlighted near the 20,800 - 21,000 range (marked at the top).
*Support Zone:* Highlighted near 19,200 - 19,400 range (marked below).
2. *Trendline:*
* An upward sloping *trendline* connecting higher lows, indicating bullish structure until the current point.
3. *Price Action Patterns:*
*Price is approaching resistance and has formed a potential *double top / bearish rejection pattern*.
*There’s a marked area showing a possible *trendline break*.
4. *Arrow Projections:*
*Green Arrow Down:* Suggests a bearish projection after breaking below trendline & resistance rejection.
*Small Blue Arrow:* Indicates the immediate bearish move after trendline break.
5. *Volume/Indicator:*
*RSI (Relative Strength Index):* At the bottom, indicating possible overbought conditions approaching 70.
6. *ATR-like Bands / Indicators:*
*Red & green bands possibly resembling a *Keltner Channel or custom volatility band* to show dynamic S\&R.
*🎯Target Clarification:*
*Target Zone:* A bearish drop towards the *support area (19,200 - 19,400)*.
* The orange highlighted area shows a *price drop of -1,286.75 points (-6.02%)*.
* Target price mentioned around *19,420*.
*📉Summary View:*
* Price is facing strong resistance.
* Potential *trendline break confirmation*.
* *Bearish target:* \~19,400 zone.
* RSI hints at possible exhaustion in bullish momentum.
Would you like me to create a trade setup (Entry, Stop Loss, Take Profit) based on this chart?
Reply "Yes setup" if you'd like it.
*Tools Used:*
1. *Support & Resistance Zones:*
*Resistance Zone:* Highlighted near the 20,800 - 21,000 range (marked at the top).
*Support Zone:* Highlighted near 19,200 - 19,400 range (marked below).
2. *Trendline:*
* An upward sloping *trendline* connecting higher lows, indicating bullish structure until the current point.
3. *Price Action Patterns:*
*Price is approaching resistance and has formed a potential *double top / bearish rejection pattern*.
*There’s a marked area showing a possible *trendline break*.
4. *Arrow Projections:*
*Green Arrow Down:* Suggests a bearish projection after breaking below trendline & resistance rejection.
*Small Blue Arrow:* Indicates the immediate bearish move after trendline break.
5. *Volume/Indicator:*
*RSI (Relative Strength Index):* At the bottom, indicating possible overbought conditions approaching 70.
6. *ATR-like Bands / Indicators:*
*Red & green bands possibly resembling a *Keltner Channel or custom volatility band* to show dynamic S\&R.
*🎯Target Clarification:*
*Target Zone:* A bearish drop towards the *support area (19,200 - 19,400)*.
* The orange highlighted area shows a *price drop of -1,286.75 points (-6.02%)*.
* Target price mentioned around *19,420*.
*📉Summary View:*
* Price is facing strong resistance.
* Potential *trendline break confirmation*.
* *Bearish target:* \~19,400 zone.
* RSI hints at possible exhaustion in bullish momentum.
Would you like me to create a trade setup (Entry, Stop Loss, Take Profit) based on this chart?
Reply "Yes setup" if you'd like it.
t.me/Xauusdanalysischartexperts
I deliver high-quality of forex signals and expert premium analysis updates, backed by meticulous analysis tools. and a commitment to exceptional results.
t.me/Xauusdanalysischartexperts
I deliver high-quality of forex signals and expert premium analysis updates, backed by meticulous analysis tools. and a commitment to exceptional results.
t.me/Xauusdanalysischartexperts
Disclaimer
The information and publications are not meant to be, and do not constitute, financial, investment, trading, or other types of advice or recommendations supplied or endorsed by TradingView. Read more in the Terms of Use.
t.me/Xauusdanalysischartexperts
I deliver high-quality of forex signals and expert premium analysis updates, backed by meticulous analysis tools. and a commitment to exceptional results.
t.me/Xauusdanalysischartexperts
I deliver high-quality of forex signals and expert premium analysis updates, backed by meticulous analysis tools. and a commitment to exceptional results.
t.me/Xauusdanalysischartexperts
Disclaimer
The information and publications are not meant to be, and do not constitute, financial, investment, trading, or other types of advice or recommendations supplied or endorsed by TradingView. Read more in the Terms of Use.