Here’s the simple breakdown:
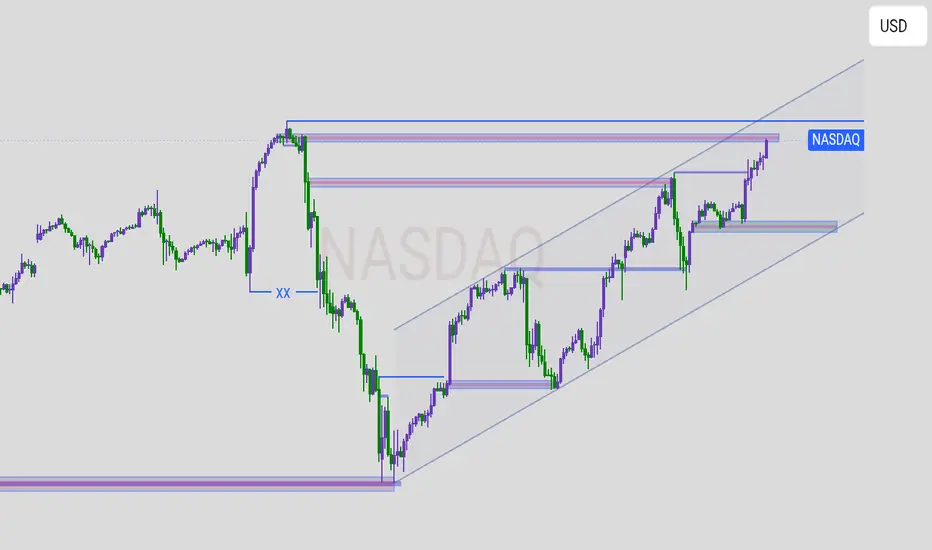
* Price is moving upward inside a rising channel
* This means NASDAQ is currently bullish.
* The price is **near the top resistance** of the channel.
* There’s a **horizontal blue resistance zone** where price has struggled before — it’s testing that level again.
* If price **breaks above** this zone, it could continue climbing toward the upper channel line.
* If price **fails** to break, it may drop back to the **nearest support zone** (the lower rectangle).
Resistance:
The top horizontal blue zone — price must break and hold above it for more upside.
* **Support:** Two blue rectangles below show where price might bounce if it drops.
* The middle support is also in line with the **channel’s lower trendline** — a strong bounce area.
* **Bullish bias**
while inside the channel.
* Watch for a **break above resistance** for a big push up, or a **rejection** for a short-term pullback to support.
Disclaimer
The information and publications are not meant to be, and do not constitute, financial, investment, trading, or other types of advice or recommendations supplied or endorsed by TradingView. Read more in the Terms of Use.
Disclaimer
The information and publications are not meant to be, and do not constitute, financial, investment, trading, or other types of advice or recommendations supplied or endorsed by TradingView. Read more in the Terms of Use.