📊 US Tech 100 (NASDAQ) Forecast Update – Multi-Stage Distribution Cycle
Asset: US Tech 100 Cash
Ticker Symbol: NASDAQ
Execution Venue: IG
Timeframe: Long-Term Projection
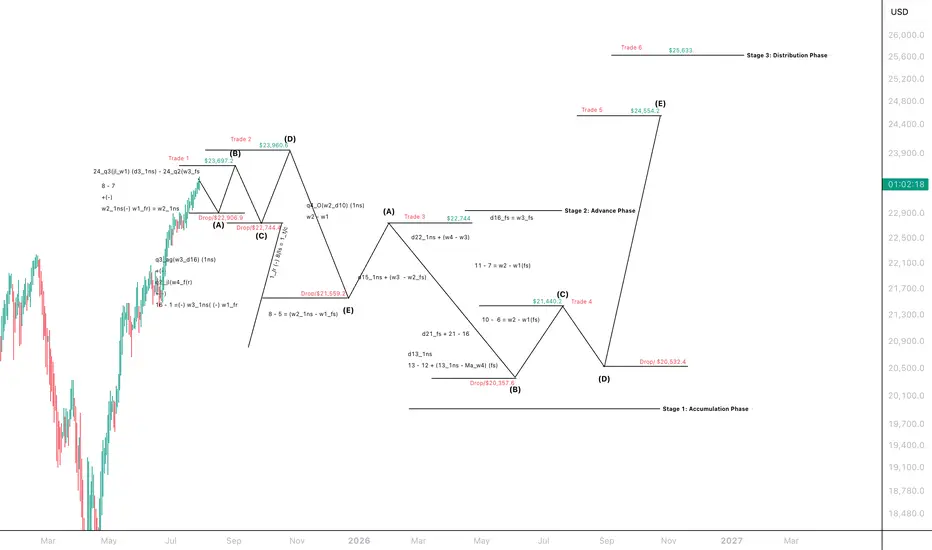
🔺 Stage 3: Distribution Phase
• First Distribution Level: $23,697.2
• Second Distribution Level: $23,960.6
Price action has completed a dual distribution top, forming a critical reversal pattern before transitioning into the next stage.
🔻 Stage 1: Accumulation Phase
• Initial Drop Post-Distribution: $21,559.2
• Short-Term Rally Opportunity: $22,744.0 (Trade 3)
• Primary Drop Targets:
• First Support: $20,357.6
• Final Accumulation Base: $20,532.4
Expect range-bound volatility within this phase as the market seeks equilibrium.
📈 Stage 2: Advance Phase
• Post-accumulation breakout targets:
• First Advance Distribution Level: $24,554.2
• Final Distribution Peak: $25,633.0
A strong recovery leg is projected once the accumulation phase completes, offering significant upside trade opportunities.
🧠 Strategic Insight:
This forecast identifies three core phases v- Distribution, Accumulation, and Advance - highlighting key entry and exit levels. The rally to $22,744.0 is a counter - trend opportunity before the primary decline to $20,357.6 $20,532.4, after which a high - probability breakout toward $25,633.0 is anticipated.
I’ll continue publishing live cycle forecasts across key assets - built with institutional discipline and retail accessibility.
Model Integrity:
This forecast is built using a proprietary cycle-based structure. Once established, the model remains fixed until the final distribution phase, allowing traders to execute with clarity and conviction. This approach contrasts sharply with conventional indicators that frequently repaint or adjust with each new data point, often compromising decision-making.
Disclaimer:
The following forecast is derived from a proprietary, hand-crafted mathematical model developed independently over several years. It does not rely on traditional indicators, technical patterns, or third-party frameworks such as Elliott Wave Theory. This model calculates price action based on distribution phases, economic timing cycles, and natural market imbalances.
#(NASDAQ) #MarketForecast #DistributionCycle #TradingModel #QuantitativeAnalysis #InstitutionalTrading #Stage3Distribution #AssetManagement #TradingStrategy #SymmetryInMarkets #ForecastAccuracy
Asset: US Tech 100 Cash
Ticker Symbol: NASDAQ
Execution Venue: IG
Timeframe: Long-Term Projection
🔺 Stage 3: Distribution Phase
• First Distribution Level: $23,697.2
• Second Distribution Level: $23,960.6
Price action has completed a dual distribution top, forming a critical reversal pattern before transitioning into the next stage.
🔻 Stage 1: Accumulation Phase
• Initial Drop Post-Distribution: $21,559.2
• Short-Term Rally Opportunity: $22,744.0 (Trade 3)
• Primary Drop Targets:
• First Support: $20,357.6
• Final Accumulation Base: $20,532.4
Expect range-bound volatility within this phase as the market seeks equilibrium.
📈 Stage 2: Advance Phase
• Post-accumulation breakout targets:
• First Advance Distribution Level: $24,554.2
• Final Distribution Peak: $25,633.0
A strong recovery leg is projected once the accumulation phase completes, offering significant upside trade opportunities.
🧠 Strategic Insight:
This forecast identifies three core phases v- Distribution, Accumulation, and Advance - highlighting key entry and exit levels. The rally to $22,744.0 is a counter - trend opportunity before the primary decline to $20,357.6 $20,532.4, after which a high - probability breakout toward $25,633.0 is anticipated.
I’ll continue publishing live cycle forecasts across key assets - built with institutional discipline and retail accessibility.
Model Integrity:
This forecast is built using a proprietary cycle-based structure. Once established, the model remains fixed until the final distribution phase, allowing traders to execute with clarity and conviction. This approach contrasts sharply with conventional indicators that frequently repaint or adjust with each new data point, often compromising decision-making.
Disclaimer:
The following forecast is derived from a proprietary, hand-crafted mathematical model developed independently over several years. It does not rely on traditional indicators, technical patterns, or third-party frameworks such as Elliott Wave Theory. This model calculates price action based on distribution phases, economic timing cycles, and natural market imbalances.
#(NASDAQ) #MarketForecast #DistributionCycle #TradingModel #QuantitativeAnalysis #InstitutionalTrading #Stage3Distribution #AssetManagement #TradingStrategy #SymmetryInMarkets #ForecastAccuracy
Institutional Note:
For institutional review, independent verification, or strategic collaboration:
institutions@bmoses.com.au
For institutional review, independent verification, or strategic collaboration:
institutions@bmoses.com.au
Disclaimer
The information and publications are not meant to be, and do not constitute, financial, investment, trading, or other types of advice or recommendations supplied or endorsed by TradingView. Read more in the Terms of Use.