As of May 26, 2025, Nestle India Ltd. (NSE: NESTLEIND) closed at ₹2,451.00, marking a 1.52% increase from the previous day. The stock's intraday range was between ₹2,405.40 and ₹2,464.90.
📊 Daily Support & Resistance Levels
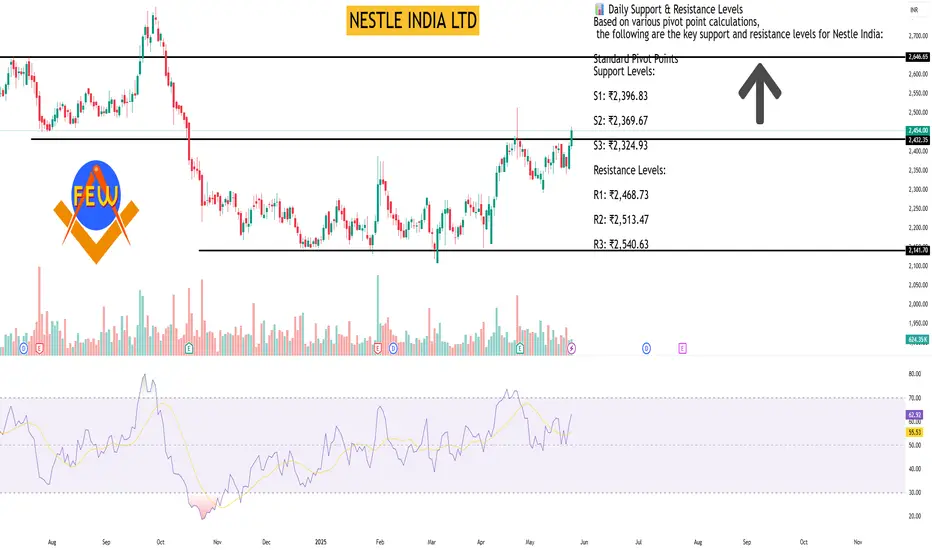
Based on various pivot point calculations, the following are the key support and resistance levels for Nestle India:
Standard Pivot Points
Support Levels:
S1: ₹2,396.83
S2: ₹2,369.67
S3: ₹2,324.93
Resistance Levels:
R1: ₹2,468.73
R2: ₹2,513.47
R3: ₹2,540.63
Fibonacci Pivot Points
Support Levels:
S1: ₹2,396.83
S2: ₹2,369.37
S3: ₹2,352.40
Resistance Levels:
R1: ₹2,424.30
R2: ₹2,441.27
R3: ₹2,468.73
Camarilla Pivot Points
Support Levels:
S1: ₹2,407.81
S2: ₹2,401.22
S3: ₹2,394.63
Resistance Levels:
R1: ₹2,420.99
R2: ₹2,427.58
R3: ₹2,434.17
📈 Technical Indicators Overview
Relative Strength Index (RSI): 70.998 — approaching overbought territory.
MACD (12,26): 17.89 — bullish crossover.
Stochastic Oscillator (9,6): 85.134 — overbought.
Average Directional Index (ADX): 56.86 — indicating a strong trend.
Moving Averages: The stock is trading above its 5-day (₹2,454.78), 10-day (₹2,436.91), 20-day (₹2,405.42), 50-day (₹2,397.91), 100-day (₹2,374.14), and 200-day (₹2,381.37) simple moving averages, suggesting a strong upward momentum.
🔍 Summary
Nestle India Ltd. is exhibiting strong bullish momentum, trading above key support levels and moving averages. However, technical indicators like RSI and Stochastic Oscillator suggest that the stock is nearing overbought conditions. Investors should monitor these levels closely for potential pullbacks or consolidations.
📊 Daily Support & Resistance Levels
Based on various pivot point calculations, the following are the key support and resistance levels for Nestle India:
Standard Pivot Points
Support Levels:
S1: ₹2,396.83
S2: ₹2,369.67
S3: ₹2,324.93
Resistance Levels:
R1: ₹2,468.73
R2: ₹2,513.47
R3: ₹2,540.63
Fibonacci Pivot Points
Support Levels:
S1: ₹2,396.83
S2: ₹2,369.37
S3: ₹2,352.40
Resistance Levels:
R1: ₹2,424.30
R2: ₹2,441.27
R3: ₹2,468.73
Camarilla Pivot Points
Support Levels:
S1: ₹2,407.81
S2: ₹2,401.22
S3: ₹2,394.63
Resistance Levels:
R1: ₹2,420.99
R2: ₹2,427.58
R3: ₹2,434.17
📈 Technical Indicators Overview
Relative Strength Index (RSI): 70.998 — approaching overbought territory.
MACD (12,26): 17.89 — bullish crossover.
Stochastic Oscillator (9,6): 85.134 — overbought.
Average Directional Index (ADX): 56.86 — indicating a strong trend.
Moving Averages: The stock is trading above its 5-day (₹2,454.78), 10-day (₹2,436.91), 20-day (₹2,405.42), 50-day (₹2,397.91), 100-day (₹2,374.14), and 200-day (₹2,381.37) simple moving averages, suggesting a strong upward momentum.
🔍 Summary
Nestle India Ltd. is exhibiting strong bullish momentum, trading above key support levels and moving averages. However, technical indicators like RSI and Stochastic Oscillator suggest that the stock is nearing overbought conditions. Investors should monitor these levels closely for potential pullbacks or consolidations.
Hello Guys ..
WhatsApp link- wa.link/d997q0
Email - techncialexpress@gmail.com ...
Script Coder/Trader//Investor from India. Drop a comment or DM if you have any questions! Let’s grow together!
WhatsApp link- wa.link/d997q0
Email - techncialexpress@gmail.com ...
Script Coder/Trader//Investor from India. Drop a comment or DM if you have any questions! Let’s grow together!
Related publications
Disclaimer
The information and publications are not meant to be, and do not constitute, financial, investment, trading, or other types of advice or recommendations supplied or endorsed by TradingView. Read more in the Terms of Use.