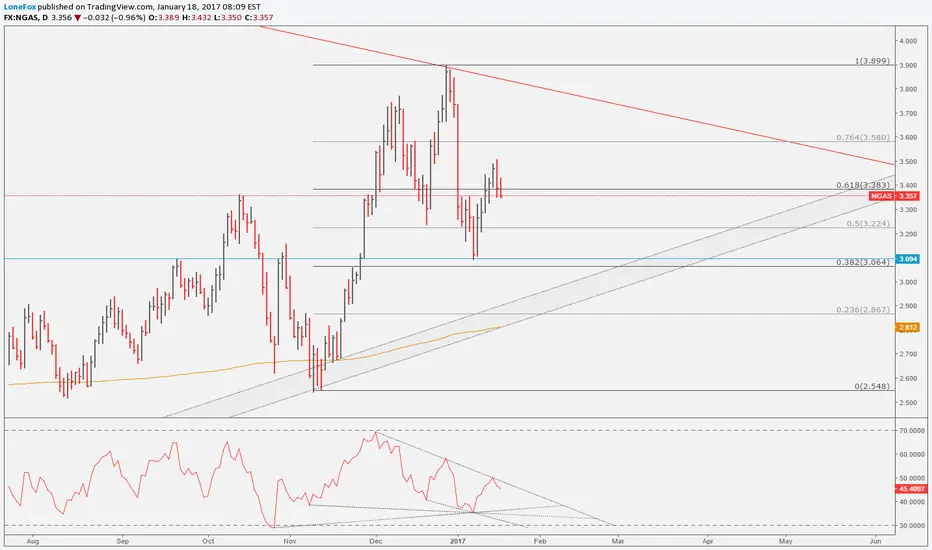
Natural gas
- Red resistance line - All time high (2014) connected to 2017 high.
- Fibonacci levels - 0.382 looks like a nice area to long.
- Major support line - The grey area.
- RSI falling wedge - A break out off the wedge would be a trend change.
Note
hitting major supportRelated publications
Disclaimer
The information and publications are not meant to be, and do not constitute, financial, investment, trading, or other types of advice or recommendations supplied or endorsed by TradingView. Read more in the Terms of Use.
Related publications
Disclaimer
The information and publications are not meant to be, and do not constitute, financial, investment, trading, or other types of advice or recommendations supplied or endorsed by TradingView. Read more in the Terms of Use.