Trading Plan for Nifty – 27-Dec-2024
Intro: Yesterday's Plan vs. Actual
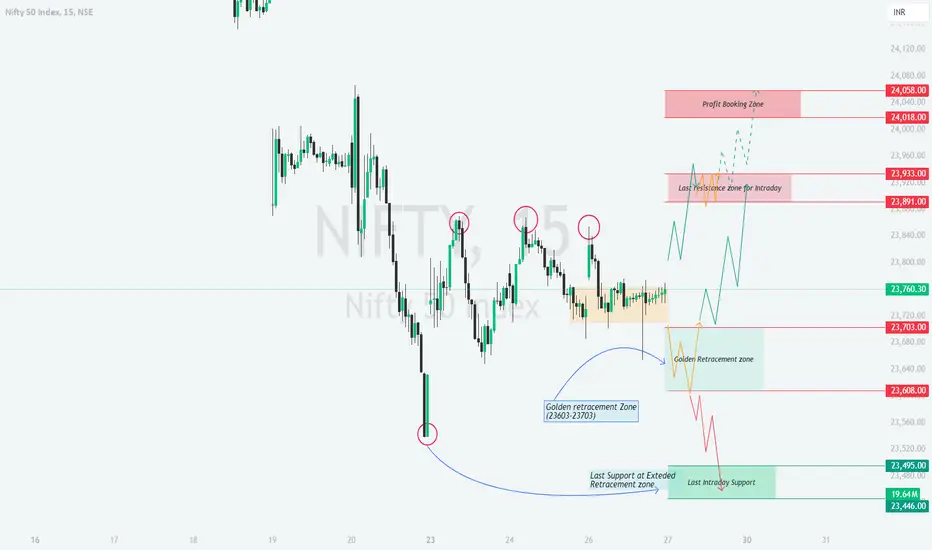
In yesterday’s plan, we highlighted the Golden Retracement Zone (23,603-23,703) and Last Resistance Zone for Intraday (23,891) as key levels to watch. The market opened near the consolidation zone (Yellow Trend), showing initial resistance at 23,760. The breakout towards 23,891 confirmed our bullish outlook (Green Trend), while reversals near the Profit Booking Zone (24,018-24,058) validated the importance of profit-taking zones.
Let’s now craft a detailed plan for 27-Dec-2024, keeping education and execution in focus.
Detailed Trading Plan for 27-Dec-2024
Intro: Yesterday's Plan vs. Actual
In yesterday’s plan, we highlighted the Golden Retracement Zone (23,603-23,703) and Last Resistance Zone for Intraday (23,891) as key levels to watch. The market opened near the consolidation zone (Yellow Trend), showing initial resistance at 23,760. The breakout towards 23,891 confirmed our bullish outlook (Green Trend), while reversals near the Profit Booking Zone (24,018-24,058) validated the importance of profit-taking zones.
Let’s now craft a detailed plan for 27-Dec-2024, keeping education and execution in focus.
Detailed Trading Plan for 27-Dec-2024
- Gap-Up Opening (+100 points or more above 23,850):
A significant gap-up indicates strength, with Nifty likely testing the Last Resistance Zone for Intraday at 23,891. Sustained trading above 23,891 could lead to a rally toward the Profit Booking Zone at 24,018-24,058. This zone should be treated as a target for intraday traders, with potential reversals expected near 24,058.
⚠️ Action Plan: Avoid chasing the gap-up blindly. Instead, wait for a retest of 23,891 for long entries. If the price holds, aim for 24,018 and beyond.
💡 Risk Management Tip: Use trailing stop losses for options trades near resistance zones to lock in profits. - Flat Opening (Near 23,760-23,850):
A flat opening suggests indecision, with Nifty likely oscillating within the Golden Retracement Zone (23,703-23,760) initially. A breakout above 23,760 could push the index towards 23,891, while a breakdown below 23,703 may trigger bearish momentum towards 23,608.
⚠️ Action Plan: Observe the first 30 minutes of price action. For bullish trades, wait for confirmation of a breakout above 23,760. For bearish trades, look for rejection at 23,703, targeting lower levels.
💡 Risk Management Tip: Straddle or strangle strategies in options can be effective in such scenarios to capture directional moves. - Gap-Down Opening (-100 points or more below 23,760):
A gap-down opens the door for bearish moves, with immediate support at 23,608. A breakdown below 23,608 can extend the decline towards the Last Support Zone at Extended Retracement (23,495-23,446). Watch for potential reversals in this demand zone for contrarian trades.
⚠️ Action Plan: Avoid panic selling at the open. Look for a bounce at 23,495 for long entries with tight stop losses. If bearish momentum sustains below 23,495, initiate short trades targeting lower levels.
💡 Risk Management Tip: For bearish trades, consider bear put spreads to manage risk in a trending market.
Summary and Conclusion
For 27-Dec-2024, the key levels to watch are 23,891 on the upside and 23,608 on the downside. Gap-up openings need patience for confirmation, while flat and gap-down scenarios offer better risk-reward opportunities. Manage your trades with proper hedging strategies and always prioritize disciplined exits.
Disclaimer
The information and publications are not meant to be, and do not constitute, financial, investment, trading, or other types of advice or recommendations supplied or endorsed by TradingView. Read more in the Terms of Use.
Disclaimer
The information and publications are not meant to be, and do not constitute, financial, investment, trading, or other types of advice or recommendations supplied or endorsed by TradingView. Read more in the Terms of Use.