Index Name: NIFTY 50
Exchange: NSE | Benchmark index of the Indian equity market
Constituents: 50 large-cap companies across 13 sectors
🧾 Overview:
The NIFTY 50 represents India’s top-performing blue-chip companies and acts as a barometer of the overall market health. It covers sectors like financials, IT, FMCG, energy, and auto.
💼 Key Sector Weights:
Financial Services – ~35%
IT – ~13%
Oil & Gas – ~12%
Consumer Goods – ~9%
Auto – ~6%
📊 Current Trend Insight (as of 4H chart):
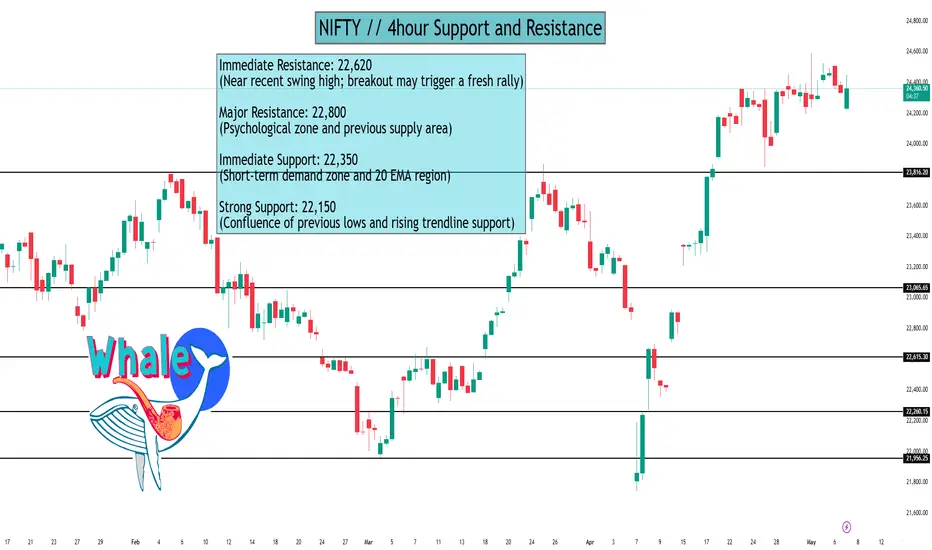
Index near resistance at 22,620
Holding support at 22,350 indicates buying strength
Sustained breakout above 22,620 could lead to a move toward 22,800+
NIFTY 50 Index – 4-Hour Chart Support & Resistance
Support and Resistance Levels (4H Timeframe):
c
Trend Insight:
NIFTY is forming higher lows, indicating bullish strength. Consolidation above 22,350 strengthens the case for a breakout. Watch 22,620 for momentum entry confirmation.
Hello Guys ..
WhatsApp link- wa.link/d997q0
Email - techncialexpress@gmail.com ...
Script Coder/Trader//Investor from India. Drop a comment or DM if you have any questions! Let’s grow together!
WhatsApp link- wa.link/d997q0
Email - techncialexpress@gmail.com ...
Script Coder/Trader//Investor from India. Drop a comment or DM if you have any questions! Let’s grow together!
Disclaimer
The information and publications are not meant to be, and do not constitute, financial, investment, trading, or other types of advice or recommendations supplied or endorsed by TradingView. Read more in the Terms of Use.
