As of the market close on May 9, 2025, the Nifty 50 index stood at 24,008.00, marking a decline of 265.80 points (-1.10%) for the day.
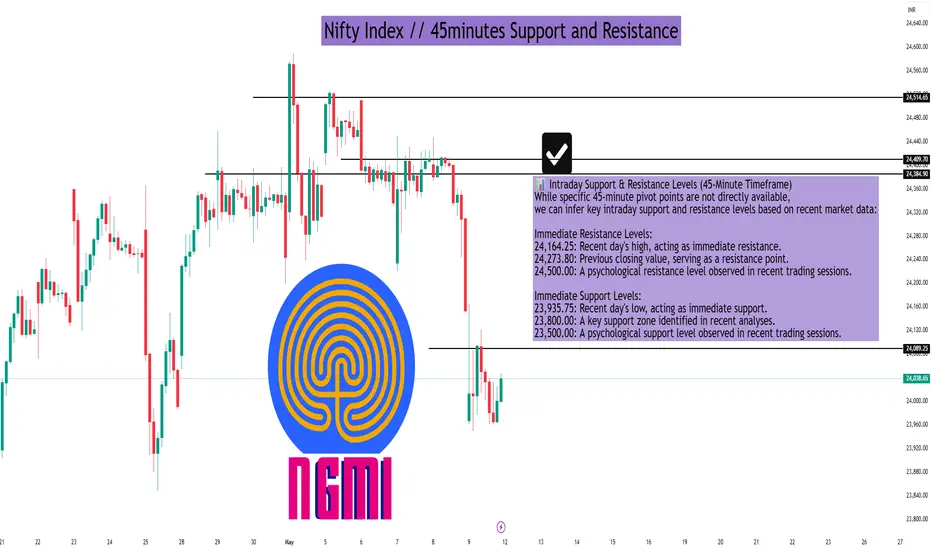
📊 Intraday Support & Resistance Levels (45-Minute Timeframe)
While specific 45-minute pivot points are not directly available, we can infer key intraday support and resistance levels based on recent market data:
Immediate Resistance Levels:
24,164.25: Recent day's high, acting as immediate resistance.
24,273.80: Previous closing value, serving as a resistance point.
24,500.00: A psychological resistance level observed in recent trading sessions.
Immediate Support Levels:
23,935.75: Recent day's low, acting as immediate support.
23,800.00: A key support zone identified in recent analyses.
23,500.00: A psychological support level observed in recent trading sessions.
🔍 Technical Indicators Summary
As per the latest technical analysis:
Relative Strength Index (RSI): 30.201 – Indicates a bearish condition.
Stochastic Oscillator (9,6): 97.279 – Suggests an overbought condition.
MACD (12,26): -105.46 – Indicates a bearish signal.
Average Directional Index (ADX): 47.759 – Suggests a strong trend.
Commodity Channel Index (CCI): -86.2237 – Indicates a bearish condition.
These indicators collectively suggest a bearish outlook for the Nifty 50 index in the short term.
📈 Trading Insights
Resistance Zone: The index faces resistance around the 24,164.25 to 24,273.80 range. A break above this zone could signal bullish momentum.
Support Zone: Support is observed around the 23,935.75 to 23,800.00 range. A breach below this zone may indicate further downside potential.
Hello Guys ..
WhatsApp link- wa.link/d997q0
Email - techncialexpress@gmail.com ...
Script Coder/Trader//Investor from India. Drop a comment or DM if you have any questions! Let’s grow together!
WhatsApp link- wa.link/d997q0
Email - techncialexpress@gmail.com ...
Script Coder/Trader//Investor from India. Drop a comment or DM if you have any questions! Let’s grow together!
Related publications
Disclaimer
The information and publications are not meant to be, and do not constitute, financial, investment, trading, or other types of advice or recommendations supplied or endorsed by TradingView. Read more in the Terms of Use.