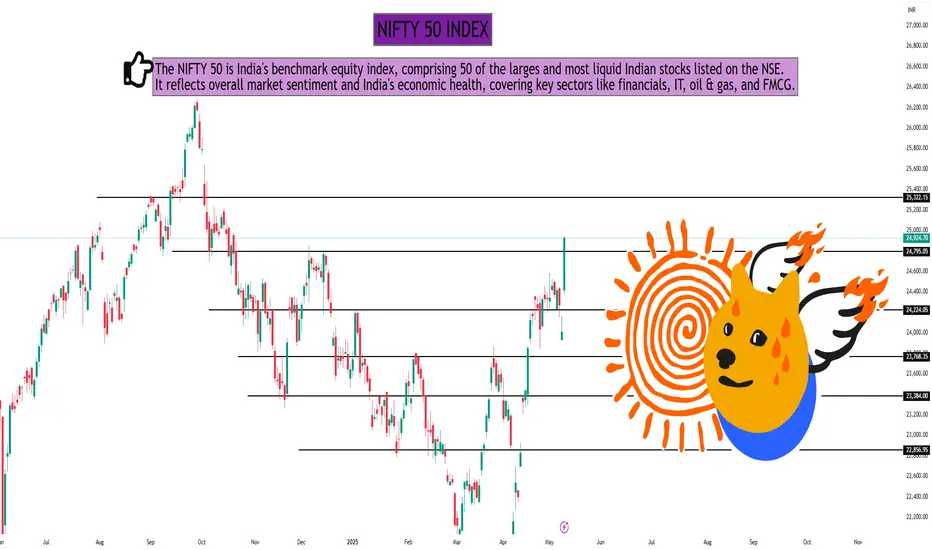
NIFTY 50 Index – 1-Day Timeframe Analysis
Technical Structure:
Trend: Uptrend intact; recent candles show strong bullish momentum.
Price Action: Forming higher highs; currently trading near resistance.
Support Levels: 22,500 / 22,200
Resistance Levels: 22,850 / 23,000
Indicators:
RSI: Around 68 – nearing overbought but still bullish
MACD: Positive crossover sustained
Volume: Rising on green candles – confirms buying interest
Outlook:
If NIFTY sustains above 22,850, a breakout toward 23,200 is likely. A rejection could lead to short-term pullback toward 22,500 support.
Hello Guys ..
WhatsApp link- wa.link/d997q0
Email - techncialexpress@gmail.com ...
Script Coder/Trader//Investor from India. Drop a comment or DM if you have any questions! Let’s grow together!
WhatsApp link- wa.link/d997q0
Email - techncialexpress@gmail.com ...
Script Coder/Trader//Investor from India. Drop a comment or DM if you have any questions! Let’s grow together!
Related publications
Disclaimer
The information and publications are not meant to be, and do not constitute, financial, investment, trading, or other types of advice or recommendations supplied or endorsed by TradingView. Read more in the Terms of Use.
