🟢 Nifty Analysis EOD – June 3, 2025 – Tuesday 🔴
Opening Sentiment vs. Reality: A Day of Dual Personality
Nifty opened with a 70-point gap-up above the previous day’s high, carrying a positive vibe. In just one minute, it surged another 57 points, marking the day’s high at 24,845. However, that bullish momentum didn’t last. The index faced strong resistance, leading to a sharp 243-point drop within 15 minutes, breaching CPR and the previous swing low to hit the first Current Day Low (CDL) at 24,601.30.
Despite the jolt, Nifty showed resilience—bounced back from the 24,625–24,640 zone, recovered to VWAP, and even retested the PDH. Yet again, it failed to hold above 24,700, echoing the morning's rejection. A second wave of selling took Nifty to a fresh low of 24,502.15 mid-session.
The closing wasn’t any better. Nifty quietly slid again, retested the breakout zone, and closed at 24,542.50, nearly at the intraday low—a day that started with hope ended on a pessimistic note.
Interestingly, India VIX also dropped, despite the downward market move—signalling premium crush and a double whammy for option buyers who got the direction right but profits wrong.
🛡 5 Min Chart with Levels

📊 Daily Summary Highlights
✅ Gap-up Start but sharp reversal
📉 Both PDH and PDL tested intraday
📉 Marubozu Engulfing Candle
⚠️ Closed below Higher Swing Low – a potential trend-shift signal
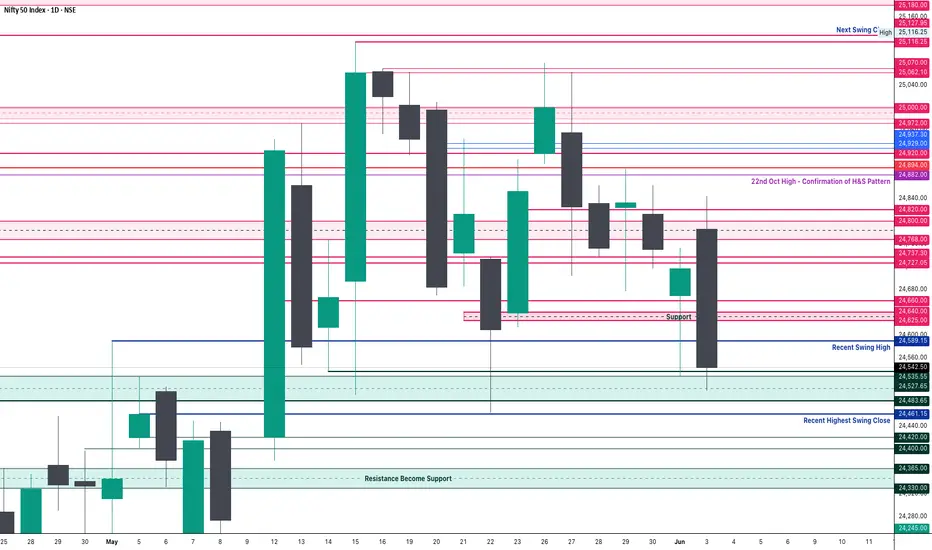
🕯 Daily Time Frame Chart

🕯 Daily Time Frame Chart

🕯 Daily Candle Breakdown
Open: 24,786.30
High: 24,845.10
Low: 24,502.15
Close: 24,542.50
Net Change: −174.10 (−0.70%)
🕯 Candle Structure
Real Body: 243.80 pts (Big red candle)
Upper Wick: 58.80 pts
Lower Wick: 40.35 pts
Interpretation
A classic bearish reversal day. Price opened higher, reached a new high, but was aggressively sold off, closing near the day’s low. This large-bodied red candle with small wicks shows clear control by the bears.
Candle Type
🟥 Bearish Marubozu-like Candle
Strong rejection at highs
Bearish dominance confirmed
Lower close signals momentum continuation to the downside
Key Insight
24,845 now acts as a firm resistance.
Break below 24,500 could accelerate correction.
Bulls need to defend 24,500–24,520 zone decisively to avoid further weakness.
🛡 5 Min Intraday Chart

⚔️ Gladiator Strategy Update
ATR: 279.13
IB Range: 243.80 → Medium IB
Market Structure: Balanced
Trades:
🔻 12:50 PM – Short Triggered → 📍 1:1 Target Achieved, but timeout
📌 Support & Resistance Zones
Resistance Levels
24,600
24,625 ~ 24,640
24,660
24,727 ~ 24,737
24,768 ~ 24,800
24,820
24,882
24,894 (Strong Resistance)
Support Levels
24,530 ~ 24,480
24,460
24,420 ~ 24,400
24,365 ~ 24,330
24,245 ~ 24,240
💭 Final Thoughts
The market showcased a classic reversal and punished emotional entries. Despite the gap-up euphoria, technical levels reigned supreme. The break below swing low could signal caution for bulls in the coming sessions.
📌 "Respect the levels, not the emotions. Every bounce is not a bottom; every fall isn’t a crash."
✏️ Disclaimer
This is just my personal viewpoint. Always consult your financial advisor before taking any action.
Opening Sentiment vs. Reality: A Day of Dual Personality
Nifty opened with a 70-point gap-up above the previous day’s high, carrying a positive vibe. In just one minute, it surged another 57 points, marking the day’s high at 24,845. However, that bullish momentum didn’t last. The index faced strong resistance, leading to a sharp 243-point drop within 15 minutes, breaching CPR and the previous swing low to hit the first Current Day Low (CDL) at 24,601.30.
Despite the jolt, Nifty showed resilience—bounced back from the 24,625–24,640 zone, recovered to VWAP, and even retested the PDH. Yet again, it failed to hold above 24,700, echoing the morning's rejection. A second wave of selling took Nifty to a fresh low of 24,502.15 mid-session.
The closing wasn’t any better. Nifty quietly slid again, retested the breakout zone, and closed at 24,542.50, nearly at the intraday low—a day that started with hope ended on a pessimistic note.
Interestingly, India VIX also dropped, despite the downward market move—signalling premium crush and a double whammy for option buyers who got the direction right but profits wrong.
🛡 5 Min Chart with Levels
📊 Daily Summary Highlights
✅ Gap-up Start but sharp reversal
📉 Both PDH and PDL tested intraday
📉 Marubozu Engulfing Candle
⚠️ Closed below Higher Swing Low – a potential trend-shift signal
🕯 Daily Time Frame Chart
🕯 Daily Time Frame Chart
🕯 Daily Candle Breakdown
Open: 24,786.30
High: 24,845.10
Low: 24,502.15
Close: 24,542.50
Net Change: −174.10 (−0.70%)
🕯 Candle Structure
Real Body: 243.80 pts (Big red candle)
Upper Wick: 58.80 pts
Lower Wick: 40.35 pts
Interpretation
A classic bearish reversal day. Price opened higher, reached a new high, but was aggressively sold off, closing near the day’s low. This large-bodied red candle with small wicks shows clear control by the bears.
Candle Type
🟥 Bearish Marubozu-like Candle
Strong rejection at highs
Bearish dominance confirmed
Lower close signals momentum continuation to the downside
Key Insight
24,845 now acts as a firm resistance.
Break below 24,500 could accelerate correction.
Bulls need to defend 24,500–24,520 zone decisively to avoid further weakness.
🛡 5 Min Intraday Chart
⚔️ Gladiator Strategy Update
ATR: 279.13
IB Range: 243.80 → Medium IB
Market Structure: Balanced
Trades:
🔻 12:50 PM – Short Triggered → 📍 1:1 Target Achieved, but timeout
📌 Support & Resistance Zones
Resistance Levels
24,600
24,625 ~ 24,640
24,660
24,727 ~ 24,737
24,768 ~ 24,800
24,820
24,882
24,894 (Strong Resistance)
Support Levels
24,530 ~ 24,480
24,460
24,420 ~ 24,400
24,365 ~ 24,330
24,245 ~ 24,240
💭 Final Thoughts
The market showcased a classic reversal and punished emotional entries. Despite the gap-up euphoria, technical levels reigned supreme. The break below swing low could signal caution for bulls in the coming sessions.
📌 "Respect the levels, not the emotions. Every bounce is not a bottom; every fall isn’t a crash."
✏️ Disclaimer
This is just my personal viewpoint. Always consult your financial advisor before taking any action.
Read my blogs here:
substack.com/@kzatakia
Follow me on Telegram:
t.me/swingtraderhub
Follow me on X:
x.com/kzatakia
substack.com/@kzatakia
Follow me on Telegram:
t.me/swingtraderhub
Follow me on X:
x.com/kzatakia
Related publications
Disclaimer
The information and publications are not meant to be, and do not constitute, financial, investment, trading, or other types of advice or recommendations supplied or endorsed by TradingView. Read more in the Terms of Use.