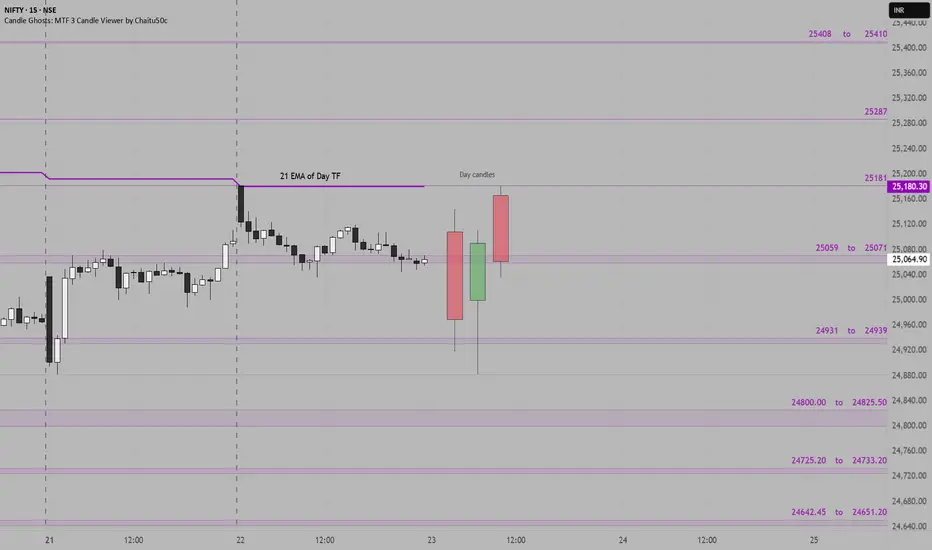
The following support and resistance zones have been identified for Nifty based on recent price structure, candle reactions, and high-activity price clusters:
Resistance Zones:
25408 – 25410
25287
25181
25059 – 25071
Support Zones:
24931 – 24939
24800 – 24825.50
24725.20 – 24733.20
24642.45 – 24651.20
Yesterday Nifty formed a strong bullish day candle after testing support near 24800, showing signs of recovery. If the price holds above 25070, we may see a move toward 25181 and possibly 25287.
These levels act as potential zones of reaction and should be used with confirmation via price action or volume triggers during live market.
Disclaimer
The information and publications are not meant to be, and do not constitute, financial, investment, trading, or other types of advice or recommendations supplied or endorsed by TradingView. Read more in the Terms of Use.
Disclaimer
The information and publications are not meant to be, and do not constitute, financial, investment, trading, or other types of advice or recommendations supplied or endorsed by TradingView. Read more in the Terms of Use.