🟢 Nifty EOD Analysis – May 3, 2025 Monday🔴
A positive open... but no follow-through. Still stuck in consolidation.
📊 Nifty Summary
Nifty opened with a gap up of 72 points at 24,420, marking the first open above 24,365 in the last 7 sessions — a positive sign. However, the enthusiasm lacked momentum. Price struggled to cross the resistance at 24,526, and the index drifted back toward the mean, trading the entire day between the initial balance (IB) range and hovering around VWAP.
🔹 Intraday Movement: Just 125 points, the smallest in the last 12 sessions — a clear sign of contraction.
🔹 Closing: 24461 closing is the first closing above 24365 in the last 7 sessions.
🔹 Structure: Daily candle formed an Inside Bar, signaling potential energy buildup.
📌 Strategy Forward: Stay alert for an expansion move from this coil — contraction often precedes sharp action.
📌 5 Min Time FrameChart
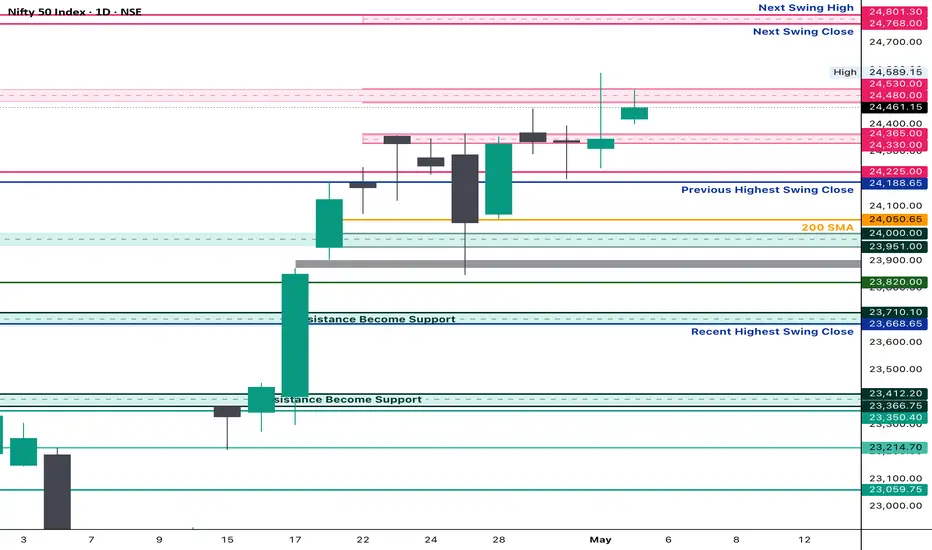
📌 Daily Time FrameChart
🕯️ Daily Time Frame Chart & Candle Breakdown
🔍 Today’s Candle Type: Spinning Top with a long upper wick
Candle Definition:
A Spinning Top reflects market indecision — both bulls and bears attempted moves, but neither gained dominance. A long upper wick with a narrow body often signals failed bullish momentum or fading enthusiasm.
📌 Today’s OHLC:
Open: 24,419.50
High: 24,526.40
Low: 24,400.65
Close: 24,461.15
Change: +114.45 (+0.47%)
🧱 Candle Structure:
🔹 Real Body:
🟢 Green candle with a modest body →
24,461.15 – 24,419.50 = 41.65 pts
🔹 Upper Wick:
24,526.40 – 24,461.15 = 65.25 pts
🔹 Lower Wick:
24,419.50 – 24,400.65 = 18.85 pts
📖 Candle’s Interpretation:
Despite a strong open and attempt to push higher, the resistance at 24,526 capped the move. The long upper wick shows that buyers lacked follow-through strength, and the close back near the middle of the range indicates a market still stuck in balance.
📉 The Inside Bar + Narrow Range combo is a potential signal for volatility ahead — traders should watch closely for a breakout from this range.
⚔️ Gladiator Strategy Update
📊 Strategy Parameters:
ATR: 303.46
IB Range: 110.65 pts
IB Category: Medium IB
Market Structure: Balanced
📌 Trade Highlights:
Trade Count: 0
❌ No Trigger generated by the system — a no-trade day.
🧠 Note: In contraction phases, it’s common to get fewer setups. Patience is key.
🔮 What’s Next?
Markets are coiling tightly, and an expansion move is likely around the corner. As long as price holds above the 24,330–24,360 band, bulls have hope — but conviction is needed above 24,540.
🧱 Support & Resistance Levels
🔺 Resistance Zones:
24,480 ~ 24,540 (Includes psychological level: 24,500)
24,590 (PDH – Immediate hurdle)
24,800
🔻 Support Zones:
24,400 (CDL)
24,330 ~ 24,360
24,190 ~ 24,225 (Immediate Support)
24,120
24,050
24,000 ~ 23,950
23,820
23,710 ~ 23,660
23,500
23,410 ~ 23,370
23,215
✏️ Disclaimer
This is just my personal viewpoint. Always consult your financial advisor before taking any action.
A positive open... but no follow-through. Still stuck in consolidation.
📊 Nifty Summary
Nifty opened with a gap up of 72 points at 24,420, marking the first open above 24,365 in the last 7 sessions — a positive sign. However, the enthusiasm lacked momentum. Price struggled to cross the resistance at 24,526, and the index drifted back toward the mean, trading the entire day between the initial balance (IB) range and hovering around VWAP.
🔹 Intraday Movement: Just 125 points, the smallest in the last 12 sessions — a clear sign of contraction.
🔹 Closing: 24461 closing is the first closing above 24365 in the last 7 sessions.
🔹 Structure: Daily candle formed an Inside Bar, signaling potential energy buildup.
📌 Strategy Forward: Stay alert for an expansion move from this coil — contraction often precedes sharp action.
📌 5 Min Time FrameChart
📌 Daily Time FrameChart
🕯️ Daily Time Frame Chart & Candle Breakdown
🔍 Today’s Candle Type: Spinning Top with a long upper wick
Candle Definition:
A Spinning Top reflects market indecision — both bulls and bears attempted moves, but neither gained dominance. A long upper wick with a narrow body often signals failed bullish momentum or fading enthusiasm.
📌 Today’s OHLC:
Open: 24,419.50
High: 24,526.40
Low: 24,400.65
Close: 24,461.15
Change: +114.45 (+0.47%)
🧱 Candle Structure:
🔹 Real Body:
🟢 Green candle with a modest body →
24,461.15 – 24,419.50 = 41.65 pts
🔹 Upper Wick:
24,526.40 – 24,461.15 = 65.25 pts
🔹 Lower Wick:
24,419.50 – 24,400.65 = 18.85 pts
📖 Candle’s Interpretation:
Despite a strong open and attempt to push higher, the resistance at 24,526 capped the move. The long upper wick shows that buyers lacked follow-through strength, and the close back near the middle of the range indicates a market still stuck in balance.
📉 The Inside Bar + Narrow Range combo is a potential signal for volatility ahead — traders should watch closely for a breakout from this range.
⚔️ Gladiator Strategy Update
📊 Strategy Parameters:
ATR: 303.46
IB Range: 110.65 pts
IB Category: Medium IB
Market Structure: Balanced
📌 Trade Highlights:
Trade Count: 0
❌ No Trigger generated by the system — a no-trade day.
🧠 Note: In contraction phases, it’s common to get fewer setups. Patience is key.
🔮 What’s Next?
Markets are coiling tightly, and an expansion move is likely around the corner. As long as price holds above the 24,330–24,360 band, bulls have hope — but conviction is needed above 24,540.
🧱 Support & Resistance Levels
🔺 Resistance Zones:
24,480 ~ 24,540 (Includes psychological level: 24,500)
24,590 (PDH – Immediate hurdle)
24,800
🔻 Support Zones:
24,400 (CDL)
24,330 ~ 24,360
24,190 ~ 24,225 (Immediate Support)
24,120
24,050
24,000 ~ 23,950
23,820
23,710 ~ 23,660
23,500
23,410 ~ 23,370
23,215
✏️ Disclaimer
This is just my personal viewpoint. Always consult your financial advisor before taking any action.
Read my blogs here:
substack.com/@kzatakia
Follow me on Telegram:
t.me/swingtraderhub
Follow me on X:
x.com/kzatakia
substack.com/@kzatakia
Follow me on Telegram:
t.me/swingtraderhub
Follow me on X:
x.com/kzatakia
Related publications
Disclaimer
The information and publications are not meant to be, and do not constitute, financial, investment, trading, or other types of advice or recommendations supplied or endorsed by TradingView. Read more in the Terms of Use.