Market Action Overview
Breakdown Below 25,000: The Nifty 50 index recently dipped below the psychologically significant level of 25,000, a move that likely triggered stop-loss orders and drew out short-sellers.
Liquidity Grab: This action can be interpreted as a classic "liquidity grab," where the market briefly breaks a key support, absorbs sell-side liquidity, and shakes out weak hands before reversing direction.
Quick Rebound: Following the breakdown, the index swiftly reclaimed the 25,000 mark, signaling a strong buy-side response and potential exhaustion of selling pressure.
Recent Trend: The index recently rebounded from a downward phase, forming a lower low before bouncing from a support zone.
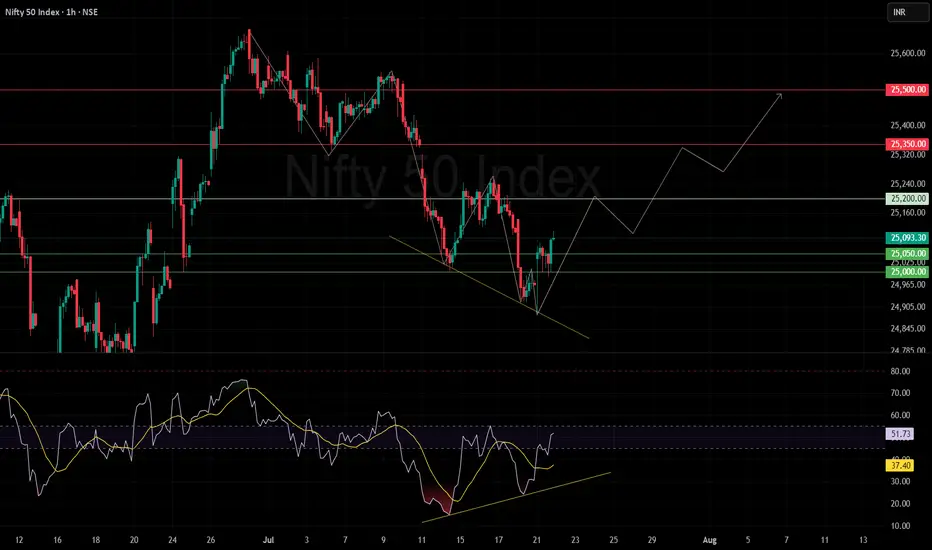
Support Levels: Key supports are visible at 25,000 and 25,050.
Resistance Levels: Notable overhead resistances are at 25,200, 25,350, and 25,500.
Potential Path & Projections
The indicated projection outlines a potential upward journey:
A base formation near current levels.
Possible upward move toward 25,200.
If sustained, a further rally toward the resistance levels of 25,350 and then 25,500.
The chart suggests a zig-zag correction/consolidation before each resistance break, implying healthy pullbacks amid the upward path.
Trendlines & Patterns
Falling Wedge Breakout: The downtrend appears to be capped by a descending trendline which has just been breached to the upside—a potentially bullish signal.
Short-Term Recovery: An optimistic bias is presented by the "inverted V" or "W-shaped" price action, hinting at accumulating strength.
RSI Pattern: The RSI is climbing from its recent lows and maintains an upward trendline also showing positive divergence with price, supporting a bullish outlook.
Momentum: If the RSI sustains above 50, momentum could stay positive; a move above 60 might trigger increased buying.
Key Takeaways
Short-Term Bias: Bullish, given breakout patterns and the upward RSI momentum.
Critical Levels to Watch:
Support: 25,000
Resistance: 25,200, 25,350, 25,500
Confirmation Needed: Watch for price acceptance above 25,200 for further bullish momentum. Failure to hold above 25,000 may invalidate the positive setup.
Conclusion
Indicators point to a potential short-term recovery for the Nifty 50, provided support holds and RSI maintains or extends its upward trajectory. Resistance breakouts above 25,200 could open the door to higher targets, but as always, traders should monitor for reversals near mapped resistance zones.
Breakdown Below 25,000: The Nifty 50 index recently dipped below the psychologically significant level of 25,000, a move that likely triggered stop-loss orders and drew out short-sellers.
Liquidity Grab: This action can be interpreted as a classic "liquidity grab," where the market briefly breaks a key support, absorbs sell-side liquidity, and shakes out weak hands before reversing direction.
Quick Rebound: Following the breakdown, the index swiftly reclaimed the 25,000 mark, signaling a strong buy-side response and potential exhaustion of selling pressure.
Recent Trend: The index recently rebounded from a downward phase, forming a lower low before bouncing from a support zone.
Support Levels: Key supports are visible at 25,000 and 25,050.
Resistance Levels: Notable overhead resistances are at 25,200, 25,350, and 25,500.
Potential Path & Projections
The indicated projection outlines a potential upward journey:
A base formation near current levels.
Possible upward move toward 25,200.
If sustained, a further rally toward the resistance levels of 25,350 and then 25,500.
The chart suggests a zig-zag correction/consolidation before each resistance break, implying healthy pullbacks amid the upward path.
Trendlines & Patterns
Falling Wedge Breakout: The downtrend appears to be capped by a descending trendline which has just been breached to the upside—a potentially bullish signal.
Short-Term Recovery: An optimistic bias is presented by the "inverted V" or "W-shaped" price action, hinting at accumulating strength.
RSI Pattern: The RSI is climbing from its recent lows and maintains an upward trendline also showing positive divergence with price, supporting a bullish outlook.
Momentum: If the RSI sustains above 50, momentum could stay positive; a move above 60 might trigger increased buying.
Key Takeaways
Short-Term Bias: Bullish, given breakout patterns and the upward RSI momentum.
Critical Levels to Watch:
Support: 25,000
Resistance: 25,200, 25,350, 25,500
Confirmation Needed: Watch for price acceptance above 25,200 for further bullish momentum. Failure to hold above 25,000 may invalidate the positive setup.
Conclusion
Indicators point to a potential short-term recovery for the Nifty 50, provided support holds and RSI maintains or extends its upward trajectory. Resistance breakouts above 25,200 could open the door to higher targets, but as always, traders should monitor for reversals near mapped resistance zones.
Disclaimer
The information and publications are not meant to be, and do not constitute, financial, investment, trading, or other types of advice or recommendations supplied or endorsed by TradingView. Read more in the Terms of Use.
Disclaimer
The information and publications are not meant to be, and do not constitute, financial, investment, trading, or other types of advice or recommendations supplied or endorsed by TradingView. Read more in the Terms of Use.