As of May 9, 2025, the Nifty Midcap Select Index is exhibiting a mildly bullish trend on the 4-hour timeframe, supported by various technical indicators and pivot point analyses.
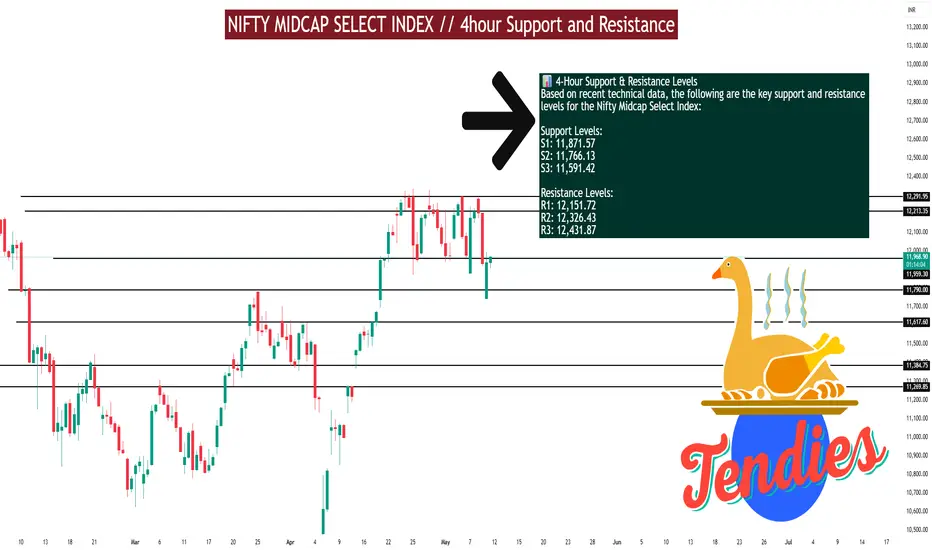
📊 4-Hour Support & Resistance Levels
Based on recent technical data, the following are the key support and resistance levels for the Nifty Midcap Select Index:
Support Levels:
S1: 11,871.57
S2: 11,766.13
S3: 11,591.42
Resistance Levels:
R1: 12,151.72
R2: 12,326.43
R3: 12,431.87
🔍 Technical Indicators (4-Hour Timeframe)
Relative Strength Index (RSI): 74.96 – approaching overbought territory, suggesting potential for a short-term pullback.
Moving Average Convergence Divergence (MACD): 250.27 – indicates bullish momentum.
Average Directional Index (ADX): 25.11 – signifies a strengthening trend.
Stochastic Oscillator: 96.87 – overbought condition, caution advised.
Supertrend Indicator: Positioned at 11,824.56 – currently acting as a support level.
Parabolic SAR: 11,733.42 – below the current price, reinforcing the bullish stance.
📈 Trend Analysis
The index is trading above its 5-period and 15-period simple moving averages on the 4-hour chart, indicating a mild bullish crossover. This suggests continued upward momentum in the near term.
⚠️ Trading Insights
Bullish Scenario: A sustained move above 12,151.72 could open the path toward 12,326.43 and potentially 12,431.87.
Bearish Scenario: Failure to hold above 11,871.57 may lead to a retest of 11,766.13 or even 11,591.42.
Hello Guys ..
WhatsApp link- wa.link/d997q0
Email - techncialexpress@gmail.com ...
Script Coder/Trader//Investor from India. Drop a comment or DM if you have any questions! Let’s grow together!
WhatsApp link- wa.link/d997q0
Email - techncialexpress@gmail.com ...
Script Coder/Trader//Investor from India. Drop a comment or DM if you have any questions! Let’s grow together!
Related publications
Disclaimer
The information and publications are not meant to be, and do not constitute, financial, investment, trading, or other types of advice or recommendations supplied or endorsed by TradingView. Read more in the Terms of Use.