NIO Inc. (NYSE: NIO):\Analyzing the Critical Zones
NIO Inc. has been in a prolonged downtrend, as evident from the chart forming a descending channel with multiple lower highs and lower lows. The current price structure highlights potential continuation patterns and critical levels to watch. Let’s delve deeper into the technical setup and price action.
Technical Breakdown
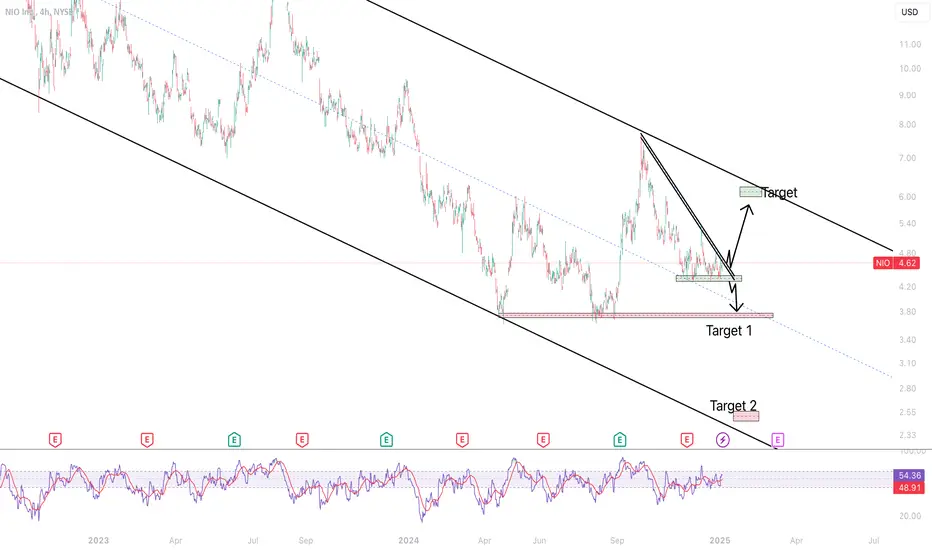
Descending Channel: NIO’s price has been steadily declining within a well-established descending channel, marked by consistent resistance at the upper boundary and support at the lower boundary. The channel suggests continued bearish sentiment unless a significant breakout occurs.
Support and Resistance Levels
Immediate Resistance: $4.66 | The chart displays a descending triangle, typically a bearish continuation pattern. The price is currently facing a confluence of resistance from a descending triangle pattern.
Target 1 (Support): $3.74 | This is a key support level, aligning with the lower range of the descending channel and a previous demand zone.
Target 2 (Support): $2.51 | A deeper downside target if the $3.74 support fails, marking the next significant area where buyers may step in.
Upside Target: $5.90 | If bullish momentum picks up, this would be a key resistance aligned with the descending channel's upper boundary.
Scenarios to Watch
⚠️ Disclaimer: This analysis is for informational purposes only and does not constitute financial advice. Always perform your own research and consult a professional before making investment decisions.
NIO Inc. has been in a prolonged downtrend, as evident from the chart forming a descending channel with multiple lower highs and lower lows. The current price structure highlights potential continuation patterns and critical levels to watch. Let’s delve deeper into the technical setup and price action.
Technical Breakdown
Descending Channel: NIO’s price has been steadily declining within a well-established descending channel, marked by consistent resistance at the upper boundary and support at the lower boundary. The channel suggests continued bearish sentiment unless a significant breakout occurs.
Support and Resistance Levels
Immediate Resistance: $4.66 | The chart displays a descending triangle, typically a bearish continuation pattern. The price is currently facing a confluence of resistance from a descending triangle pattern.
Target 1 (Support): $3.74 | This is a key support level, aligning with the lower range of the descending channel and a previous demand zone.
Target 2 (Support): $2.51 | A deeper downside target if the $3.74 support fails, marking the next significant area where buyers may step in.
Upside Target: $5.90 | If bullish momentum picks up, this would be a key resistance aligned with the descending channel's upper boundary.
Scenarios to Watch
- Bearish Case: A breakdown below $4.30 would likely confirm the descending triangle’s bearish bias. This could lead to a swift move toward $3.74 (Target 1) and, in the worst case, to $2.51 (Target 2).
- Bullish Case: A breakout above $4.90 would invalidate the descending triangle and suggest a reversal toward $5.90. A confirmed breakout would require strong volume and sustained momentum.
⚠️ Disclaimer: This analysis is for informational purposes only and does not constitute financial advice. Always perform your own research and consult a professional before making investment decisions.
Disclaimer
The information and publications are not meant to be, and do not constitute, financial, investment, trading, or other types of advice or recommendations supplied or endorsed by TradingView. Read more in the Terms of Use.
Disclaimer
The information and publications are not meant to be, and do not constitute, financial, investment, trading, or other types of advice or recommendations supplied or endorsed by TradingView. Read more in the Terms of Use.