📌 Title:
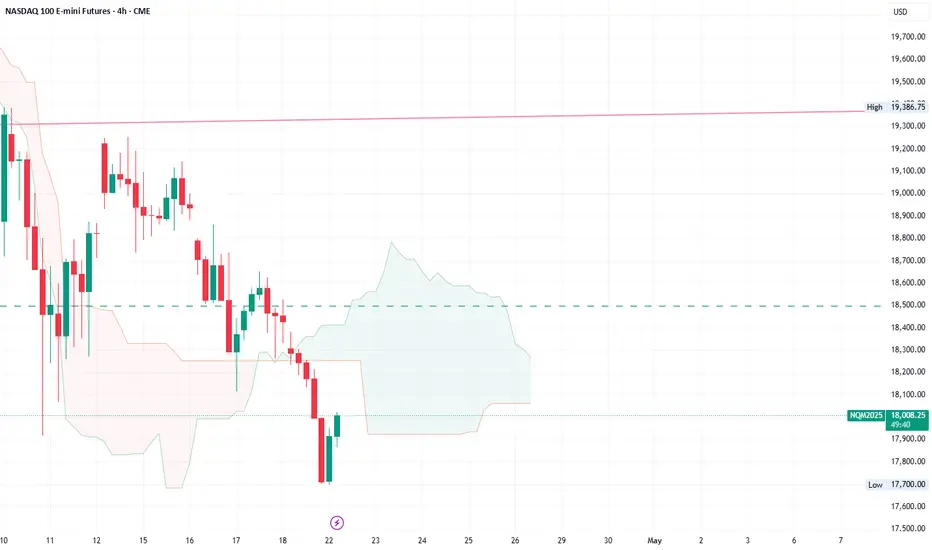
NASDAQ – 18,000 Holding, But Downside Risk Remains
Review of Last week's outlook:
I said that buying between 18,600 and 18,700 on the 12-hour chart would be reasonable,
but if a 12-hour candle closed below 18,500, it would be a major warning signal.
That strategy was valid at least until Tuesday.
But then three more 12-hour candles formed,
and Tuesday's closing price was 18,938.
The market opened Wednesday with a gap down at 18,790.
Looking at the chart at that time,
price had dropped below the 200-day line on the 2-day chart,
and the 12-hour chart was also not looking good.
So the strategy of buying near 18,600 on the 12-hour chart was no longer valid.
I had mentioned that if a 12-hour candle closed below 18,500,
it could get very dangerous.
And on the 4-hour chart, I had suggested short-term scalping was possible in the low 18,000s.
As expected, there was one bounce from that level,
but the price continued to fall after that.
📋 Description:
Now, NASDAQ is currently hovering near 18,000.
Although volatility remains low, price action continues to drift lower with weak momentum on higher timeframes.
Key Technical Observations:
• 📉 Still inside the 5-day bullish Ichimoku cloud
• 📍 17,000 = Bottom of the Bi-weekly Kumo + 3D 200SMA
• 📍 16,500 = Previous swing low, potential double bottom area
• 📈 18,400 = Needs to be reclaimed by weekly close to consider range recovery
A clean break below 17,700 could open the path toward 17,000, and possibly lower.
For now, this is a watch-and-react zone not yet a clear buy or sell signal, but conditions are forming for the next move.
🔁 Bias: Neutral to Bearish
⏳ Strategy: Wait for confirmation at 17,700 or breakdown
PinoChart
Pino's Market insights & strategy setups & Real-time ideas. Weekly setups.
youtube.com/@pinochart
Pino's Market insights & strategy setups & Real-time ideas. Weekly setups.
youtube.com/@pinochart
Disclaimer
The information and publications are not meant to be, and do not constitute, financial, investment, trading, or other types of advice or recommendations supplied or endorsed by TradingView. Read more in the Terms of Use.