🔍 Chart Setup & Trend
Timeframe: Daily chart
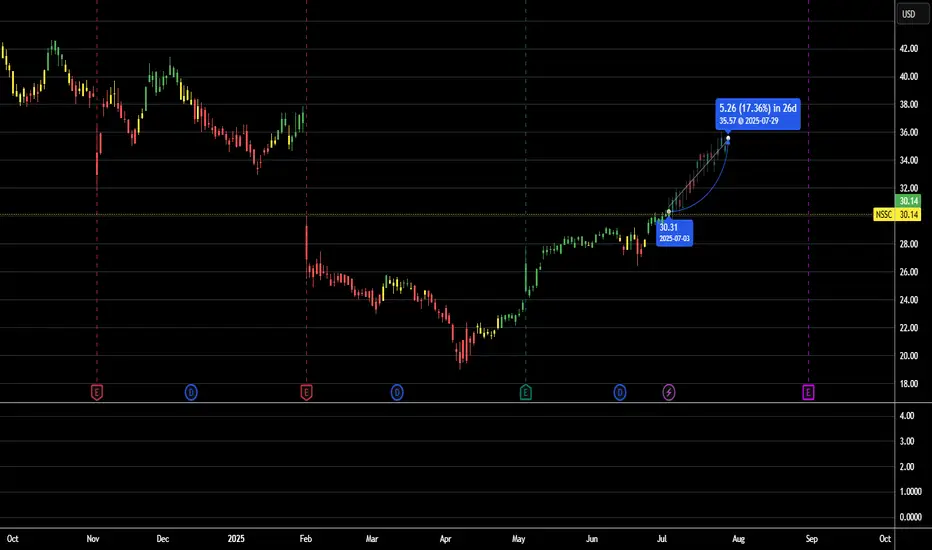
Trend: NSSC has recently rebounded from support around $28 and is attempting a short-term recovery after a corrective phase.
The price is back above the 20-day EMA, signaling renewed buying interest.
A move above $31.00–$31.50 resistance could trigger a bullish breakout.
📊 Key Technical Indicators
RSI: ~54
↳ Neutral zone, with room to move toward overbought territory.
MACD: Bullish crossover is forming
↳ Indicates upside momentum building.
Volume: Increasing volume on green days—suggests accumulation phase.
🔧 Support & Resistance
Support: $28.50 (recent bounce zone)
Resistance 1: $31.00 (near-term ceiling)
Resistance 2: $33.50
17% Price Target: $35.26
🎯 Trade Plan (Short-Term Swing)
Entry: $30.14 (or breakout confirmation above $31.00)
Target (17% gain): $35.26
Stop-loss: $28.40 (below recent swing low and EMA support)
Risk/Reward Ratio: ~1:2.2
📈 Example Calculation
Entry: $30.14
Target: $35.26
Stop-loss: $28.40
Potential Gain: $5.12
Potential Loss: $1.74
⚠️ Risks
If $31.00 fails to break, the stock could range or retest lower support.
Broader tech/security sector weakness could dragNSSC even if setup looks bullish.
Keep an eye on earnings dates or macroeconomic risk (interest rates, spending cuts, etc.).
✅ Summary
Napco Security Technologies (NSSC) shows early signs of a trend reversal. With momentum building above key short-term moving averages, a 17% move to $35.26 is feasible if the stock breaks through $31 with strength.
Entry: ~$30.14
Target: $35.26
Stop-loss: ~$28.40
Outlook: Cautiously Bullish, confirmation above $31 preferred.
Timeframe: Daily chart
Trend:
The price is back above the 20-day EMA, signaling renewed buying interest.
A move above $31.00–$31.50 resistance could trigger a bullish breakout.
📊 Key Technical Indicators
RSI: ~54
↳ Neutral zone, with room to move toward overbought territory.
MACD: Bullish crossover is forming
↳ Indicates upside momentum building.
Volume: Increasing volume on green days—suggests accumulation phase.
🔧 Support & Resistance
Support: $28.50 (recent bounce zone)
Resistance 1: $31.00 (near-term ceiling)
Resistance 2: $33.50
17% Price Target: $35.26
🎯 Trade Plan (Short-Term Swing)
Entry: $30.14 (or breakout confirmation above $31.00)
Target (17% gain): $35.26
Stop-loss: $28.40 (below recent swing low and EMA support)
Risk/Reward Ratio: ~1:2.2
📈 Example Calculation
Entry: $30.14
Target: $35.26
Stop-loss: $28.40
Potential Gain: $5.12
Potential Loss: $1.74
⚠️ Risks
If $31.00 fails to break, the stock could range or retest lower support.
Broader tech/security sector weakness could drag
Keep an eye on earnings dates or macroeconomic risk (interest rates, spending cuts, etc.).
✅ Summary
Napco Security Technologies (
Entry: ~$30.14
Target: $35.26
Stop-loss: ~$28.40
Outlook: Cautiously Bullish, confirmation above $31 preferred.
Disclaimer
The information and publications are not meant to be, and do not constitute, financial, investment, trading, or other types of advice or recommendations supplied or endorsed by TradingView. Read more in the Terms of Use.
Disclaimer
The information and publications are not meant to be, and do not constitute, financial, investment, trading, or other types of advice or recommendations supplied or endorsed by TradingView. Read more in the Terms of Use.