Hello, traders.
If you "Follow", you can always get new information quickly.
Please also click "Boost".
Have a nice day today.
-------------------------------------
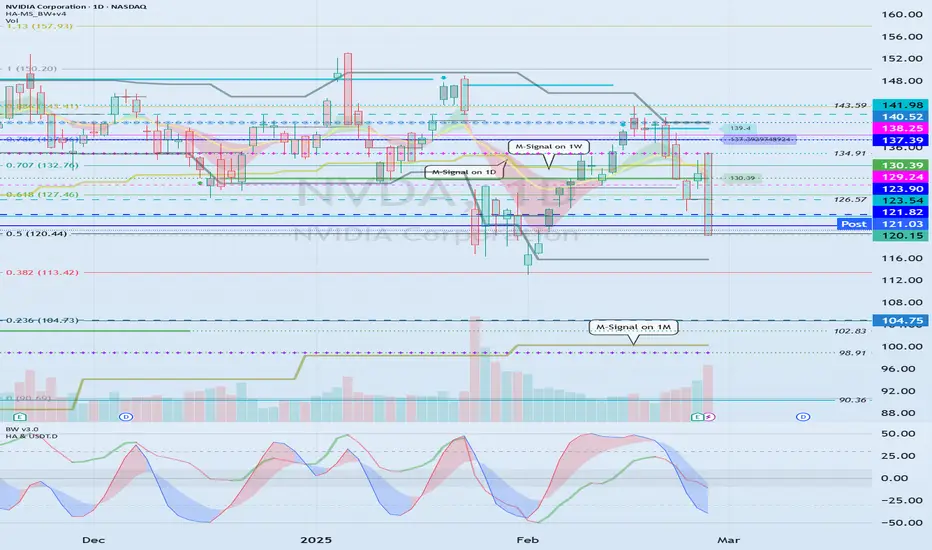
(NVDA 1W chart)
The key is whether it can receive support and rise around the Fibonacci ratio range of 0.5 (120.14) ~ 0.618 (127.46).
If not, and it falls, it is expected to touch the M-Signal indicator on the 1M chart.
Accordingly, there is a possibility that it will touch around 104.75.
-
(1D chart)
The key is whether it can rise above 121.82-123.90 and receive support.
If not,
1st: Fibonacci ratio 0.382 (113.42)
2nd: 104.75
You need to check whether it is supported near the 1st and 2nd above.
At this time, the important thing is whether the price can be maintained above the M-Signal indicator of the 1M chart.
If it falls below the M-Signal indicator of the 1M chart and remains, it is likely to turn into a downtrend, so be careful when trading.
-
Thank you for reading to the end.
I hope you have a successful trade.
--------------------------------------------------
Other content (coins, stocks, etc.) is frequently posted on X.
X에 다른 내용(코인, 주식 등)이 자주 게시됩니다.
◆ t.me/readCryptoChannel
[HA-MS Indicator]
bit.ly/3YxHgvN
[OBV Indicator]
bit.ly/4dcyny3
X에 다른 내용(코인, 주식 등)이 자주 게시됩니다.
◆ t.me/readCryptoChannel
[HA-MS Indicator]
bit.ly/3YxHgvN
[OBV Indicator]
bit.ly/4dcyny3
Disclaimer
The information and publications are not meant to be, and do not constitute, financial, investment, trading, or other types of advice or recommendations supplied or endorsed by TradingView. Read more in the Terms of Use.