https://www.tradingview.com/x/n2WCvjzC/
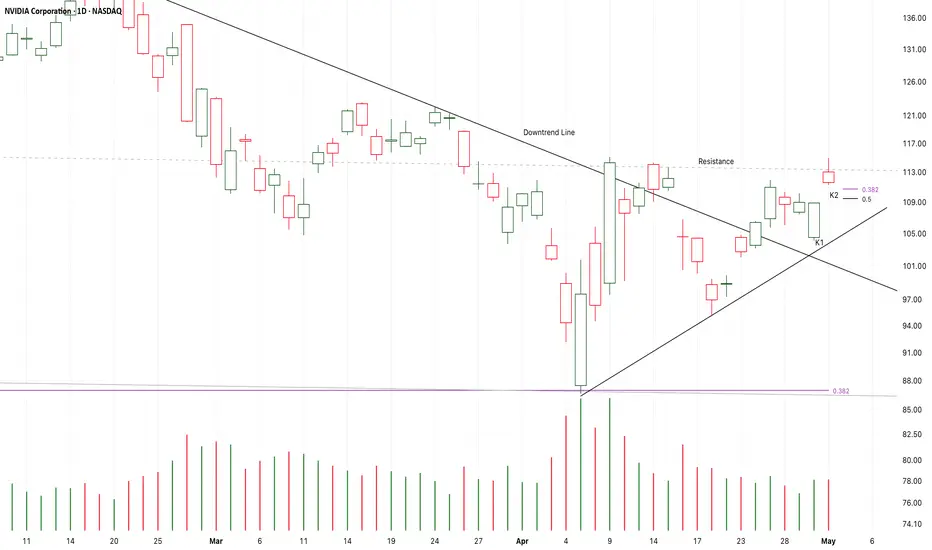
The recent several candles is a consolidation along the resistance.
And the supply pressure keeps at low level.
K1 is a bullish candle and it is also a potential right shoulder of a larger scale bullish head-shoulder pattern.
If the following candles close upon K2,
It is likely that another bull run will start here to test 125USD area.
On the other hand,
If K3 close below the bull gap at K2,
The risk will increase.
Long-110.5/Stop-109/Target-125
Note
After K1 break up the resistance for a second time,
K2 and K3 tested it under low supply pressure.
If K4 break up K2,
It will be a good place to buy it here.
On the other hand,
If K4 failed to close upon K2 or even break down K3,
The risk will sharply increase.
Long-116.65/Stop-115/Target-125
Disclaimer
The information and publications are not meant to be, and do not constitute, financial, investment, trading, or other types of advice or recommendations supplied or endorsed by TradingView. Read more in the Terms of Use.
Disclaimer
The information and publications are not meant to be, and do not constitute, financial, investment, trading, or other types of advice or recommendations supplied or endorsed by TradingView. Read more in the Terms of Use.