NVDA Option Income Strategy ETF (NVDY) – Daily & Weekly TA Break
Been watching  NVDY closely — wanted to share some confluence I found between the daily and weekly charts.
🪜 Weekly Chart Breakdown
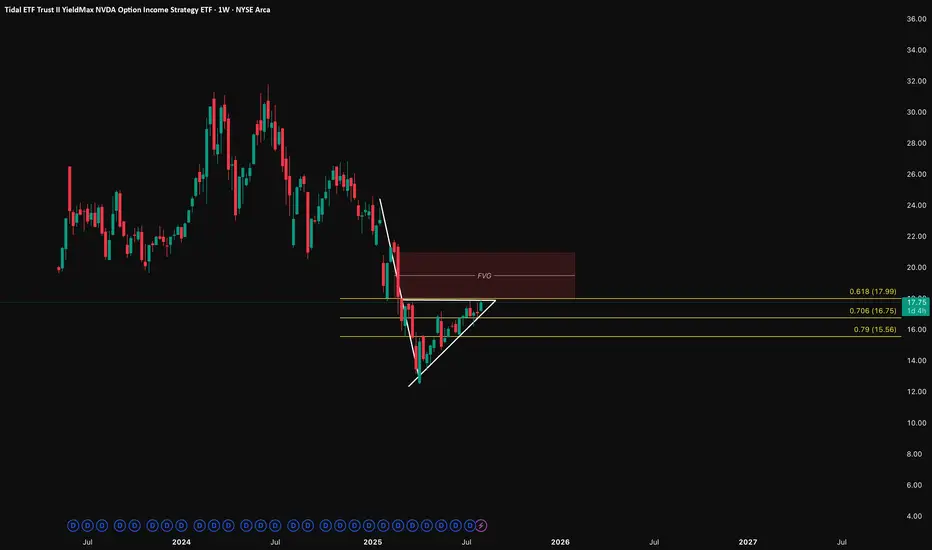
Zoomed out, drew fibs on the big swing — top to bottom. Here’s where we’re cooking:
• 0.618 at 17.99
• 0.706 at 16.75
• 0.79 at 15.56
We’re dancing right at that golden pocket, and there’s a nasty little FVG above just waiting to get filled. This thing dumped hard, and now it’s walking its way back up like it remembered it had bills to pay.
🕵️♂️ Daily Chart Breakdown
Caught a tight ascending triangle pressing up into that 0.618 level.
Price is respecting both trendline and resistance like it’s trying to decide if it’s ready to throw hands or fold.
• Higher lows stacking like bricks.
• Resistance is flatlined right under $18.
• Volume’s low but steady — pressure’s building.
⚔️ What I’m Watching
• Breakout above $18 with volume? We could rip into that FVG like butter. Eyes on $20–21 for potential fill.
• Rejection at the top? I’m not crying — I’ll catch it at $16.75 or $15.56. That’s where the fib gods are lurking.
Final Word
I ain’t trying to overcomplicate this — the levels are speaking loud.
Weekly gave me the roadmap, daily gave me the ignition.
Watching close. This one’s either a send or a snipe.
Let me know if y’all see it the same or if I missed something.
🪜 Weekly Chart Breakdown
Zoomed out, drew fibs on the big swing — top to bottom. Here’s where we’re cooking:
• 0.618 at 17.99
• 0.706 at 16.75
• 0.79 at 15.56
We’re dancing right at that golden pocket, and there’s a nasty little FVG above just waiting to get filled. This thing dumped hard, and now it’s walking its way back up like it remembered it had bills to pay.
🕵️♂️ Daily Chart Breakdown
Caught a tight ascending triangle pressing up into that 0.618 level.
Price is respecting both trendline and resistance like it’s trying to decide if it’s ready to throw hands or fold.
• Higher lows stacking like bricks.
• Resistance is flatlined right under $18.
• Volume’s low but steady — pressure’s building.
⚔️ What I’m Watching
• Breakout above $18 with volume? We could rip into that FVG like butter. Eyes on $20–21 for potential fill.
• Rejection at the top? I’m not crying — I’ll catch it at $16.75 or $15.56. That’s where the fib gods are lurking.
Final Word
I ain’t trying to overcomplicate this — the levels are speaking loud.
Weekly gave me the roadmap, daily gave me the ignition.
Watching close. This one’s either a send or a snipe.
Let me know if y’all see it the same or if I missed something.
Disclaimer
The information and publications are not meant to be, and do not constitute, financial, investment, trading, or other types of advice or recommendations supplied or endorsed by TradingView. Read more in the Terms of Use.
Disclaimer
The information and publications are not meant to be, and do not constitute, financial, investment, trading, or other types of advice or recommendations supplied or endorsed by TradingView. Read more in the Terms of Use.