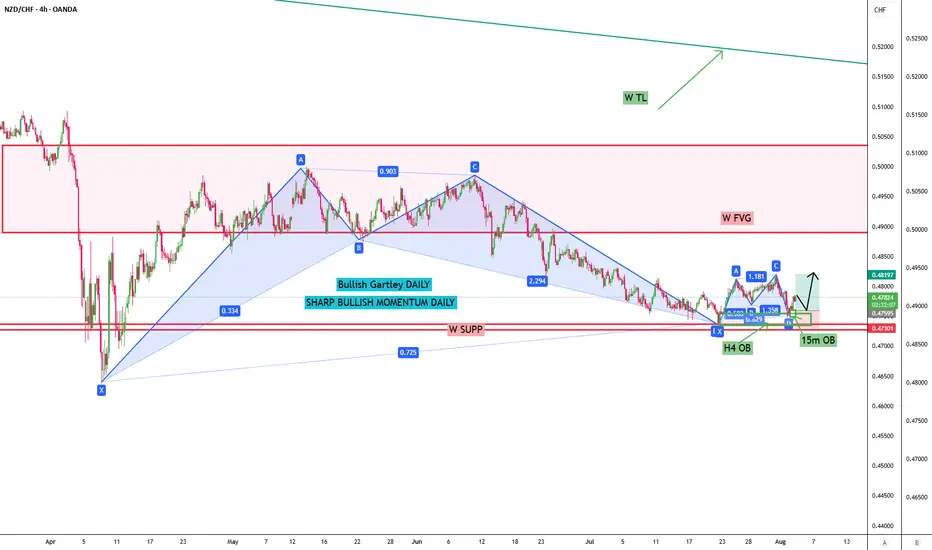
Weekly chart shows NZDCHF has bounced off its minimum since 2004, with RSI showing just recovering from the OS area. Price has bounced back from the weekly resistance around 0.47400. This bounce has formed a bullish Gartley on the daily chart and another bullish Gartley on the H4 timeframe. It was supported by an OB on H4 and in micro scale engulfing candles.
I expect that the 20 MA will reject the price on H4 BB since multiple bearish candles passed the lower band.
Would consider the entry where the 15m OB was touched by a rejected wick around 0.47600. TPs may be around points A and C on the Gartley pattern, and SL below the X point.
Let's see how it goes, and fingers crossed, the pending gets activated.
Disclaimer
The information and publications are not meant to be, and do not constitute, financial, investment, trading, or other types of advice or recommendations supplied or endorsed by TradingView. Read more in the Terms of Use.
Disclaimer
The information and publications are not meant to be, and do not constitute, financial, investment, trading, or other types of advice or recommendations supplied or endorsed by TradingView. Read more in the Terms of Use.