Market Analysis: NZD/USD Dips
NZD/USD is trimming gains and struggling to stay above the 0.5945 pivot zone.
Important Takeaways for NZD/USD Analysis Today
- NZD/USD is declining from the 0.6030 resistance zone.
- There is a major bearish trend line forming with resistance near 0.5970 on the hourly chart of NZD/USD at FXOpen.
NZD/USD Technical Analysis

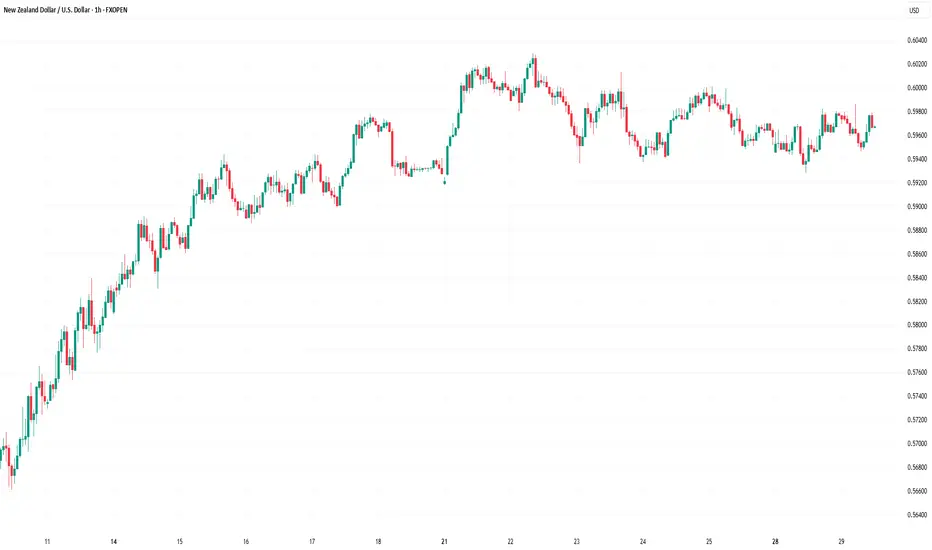
On the hourly chart of NZD/USD on FXOpen, the pair attempted another wave above the 0.6000 zone but failed. The New Zealand Dollar started another downward move from 0.6000 and dipped below 0.5980 against the US Dollar.
The pair settled below the 0.5970 level and the 50-hour simple moving average. It tested the 0.5930 zone and is currently consolidating losses near the 50% Fib retracement level of the downward move from the 0.6000 swing high to the 0.5928 low.
The NZD/USD chart suggests that the RSI is now well below 50 and signaling more downsides. On the downside, there is major support forming near 0.5945.
The next major support is near the 0.5920 level. If there is a downside break below the 0.5920 support, the pair might slide toward the 0.5880 support. Any more losses could lead NZD/USD in a bearish zone to 0.5840.
On the upside, the pair might struggle near 0.5970 and the 61.8% Fib retracement level of the downward move from the 0.6000 swing high to the 0.5928 low.
There is also a major bearish trend line forming with resistance near 0.5970. The next major resistance is near the 0.5985 level. A clear move above the 0.5985 level might even push the pair toward the 0.6000 level. Any more gains might clear the path for a move toward the 0.6030 resistance zone in the coming days.
This article represents the opinion of the Companies operating under the FXOpen brand only. It is not to be construed as an offer, solicitation, or recommendation with respect to products and services provided by the Companies operating under the FXOpen brand, nor is it to be considered financial advice.
NZD/USD is trimming gains and struggling to stay above the 0.5945 pivot zone.
Important Takeaways for NZD/USD Analysis Today
- NZD/USD is declining from the 0.6030 resistance zone.
- There is a major bearish trend line forming with resistance near 0.5970 on the hourly chart of NZD/USD at FXOpen.
NZD/USD Technical Analysis
On the hourly chart of NZD/USD on FXOpen, the pair attempted another wave above the 0.6000 zone but failed. The New Zealand Dollar started another downward move from 0.6000 and dipped below 0.5980 against the US Dollar.
The pair settled below the 0.5970 level and the 50-hour simple moving average. It tested the 0.5930 zone and is currently consolidating losses near the 50% Fib retracement level of the downward move from the 0.6000 swing high to the 0.5928 low.
The NZD/USD chart suggests that the RSI is now well below 50 and signaling more downsides. On the downside, there is major support forming near 0.5945.
The next major support is near the 0.5920 level. If there is a downside break below the 0.5920 support, the pair might slide toward the 0.5880 support. Any more losses could lead NZD/USD in a bearish zone to 0.5840.
On the upside, the pair might struggle near 0.5970 and the 61.8% Fib retracement level of the downward move from the 0.6000 swing high to the 0.5928 low.
There is also a major bearish trend line forming with resistance near 0.5970. The next major resistance is near the 0.5985 level. A clear move above the 0.5985 level might even push the pair toward the 0.6000 level. Any more gains might clear the path for a move toward the 0.6030 resistance zone in the coming days.
This article represents the opinion of the Companies operating under the FXOpen brand only. It is not to be construed as an offer, solicitation, or recommendation with respect to products and services provided by the Companies operating under the FXOpen brand, nor is it to be considered financial advice.
Disclaimer
The information and publications are not meant to be, and do not constitute, financial, investment, trading, or other types of advice or recommendations supplied or endorsed by TradingView. Read more in the Terms of Use.
Disclaimer
The information and publications are not meant to be, and do not constitute, financial, investment, trading, or other types of advice or recommendations supplied or endorsed by TradingView. Read more in the Terms of Use.