Based on the 4-hour chart of NZD/USD, here's a technical analysis of the current setup:
\---
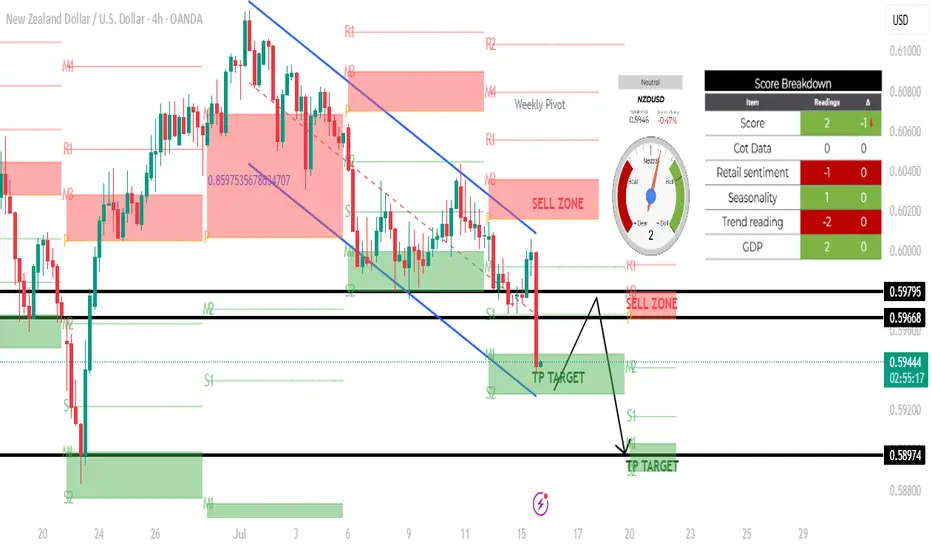
🕒 Timeframe: 4H
💱 Pair: NZD/USD
📉 Current Price: Around 0.59430
---
🔍 Chart Structure and Analysis:
🔻 Trend:
The market is in a clear downtrend, as indicated by the descending channel and the strong bearish candle that broke below the previous support zone.
Sellers are currently in control.
---
📍 Key Zones:
🔴 Sell Zones (Supply):
0.59668 – 0.59795: Marked as a supply/sell zone.
Price previously reacted here and dropped sharply. Expect selling pressure if price retests this zone.
---
🟢 Take Profit (TP) Targets / Demand Zones:
1. TP Target 1: Around 0.59430 – 0.59300 — Already hit; slight bounce seen.
2. TP Target 2: 0.58974 — This is the next key target/support zone, which aligns with a prior low.
---
🔁 Possible Scenarios:
✅ Scenario 1: Continuation Bearish
If price fails to break back above the 0.59668 resistance, it will likely:
Consolidate below,
Retest and reject again,
Then head lower toward 0.58974 (TP2).
⚠ Scenario 2: Short-Term Retracement
If there's a bounce (as seen by the current candle's wick), price may retest the sell zone at 0.59668–0.59795.
This could present another short entry opportunity with a target at 0.58974.
---
📊 Confluences:
Weekly Pivot + Structure Resistance near 0.59668: Strengthens the sell zone.
Strong Bearish Momentum Candle: Signals potential for continuation.
TP Zone overlaps with S2 level: Providing possible support/bounce area.
\---
🕒 Timeframe: 4H
💱 Pair: NZD/USD
📉 Current Price: Around 0.59430
---
🔍 Chart Structure and Analysis:
🔻 Trend:
The market is in a clear downtrend, as indicated by the descending channel and the strong bearish candle that broke below the previous support zone.
Sellers are currently in control.
---
📍 Key Zones:
🔴 Sell Zones (Supply):
0.59668 – 0.59795: Marked as a supply/sell zone.
Price previously reacted here and dropped sharply. Expect selling pressure if price retests this zone.
---
🟢 Take Profit (TP) Targets / Demand Zones:
1. TP Target 1: Around 0.59430 – 0.59300 — Already hit; slight bounce seen.
2. TP Target 2: 0.58974 — This is the next key target/support zone, which aligns with a prior low.
---
🔁 Possible Scenarios:
✅ Scenario 1: Continuation Bearish
If price fails to break back above the 0.59668 resistance, it will likely:
Consolidate below,
Retest and reject again,
Then head lower toward 0.58974 (TP2).
⚠ Scenario 2: Short-Term Retracement
If there's a bounce (as seen by the current candle's wick), price may retest the sell zone at 0.59668–0.59795.
This could present another short entry opportunity with a target at 0.58974.
---
📊 Confluences:
Weekly Pivot + Structure Resistance near 0.59668: Strengthens the sell zone.
Strong Bearish Momentum Candle: Signals potential for continuation.
TP Zone overlaps with S2 level: Providing possible support/bounce area.
Disclaimer
The information and publications are not meant to be, and do not constitute, financial, investment, trading, or other types of advice or recommendations supplied or endorsed by TradingView. Read more in the Terms of Use.
Disclaimer
The information and publications are not meant to be, and do not constitute, financial, investment, trading, or other types of advice or recommendations supplied or endorsed by TradingView. Read more in the Terms of Use.