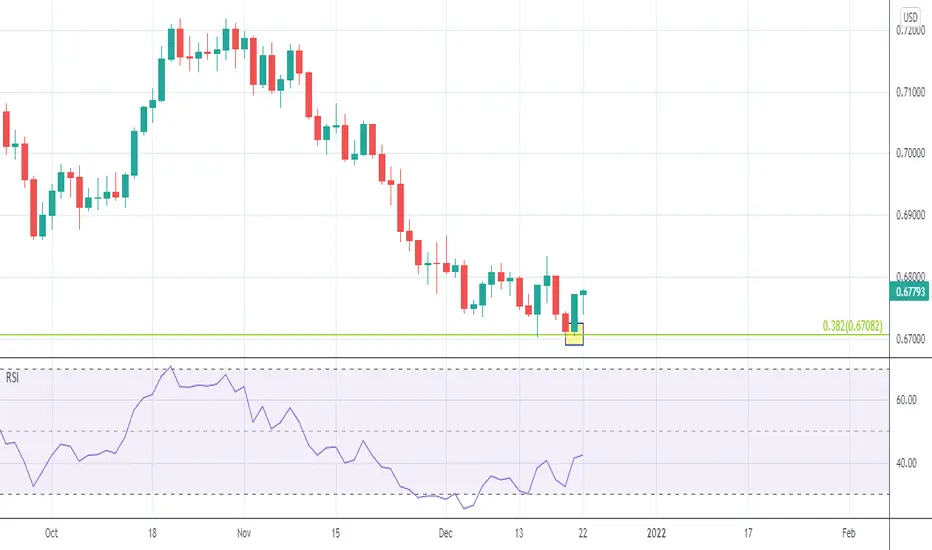
NZDUSD tests 0.382 Fibonacci retracement support with Bullish Engulfing candlestick pattern and RSI daily unfolds bullish divergence, looks like NZDUSD eyes higher from the recent low.
Disclaimer
The information and publications are not meant to be, and do not constitute, financial, investment, trading, or other types of advice or recommendations supplied or endorsed by TradingView. Read more in the Terms of Use.
Disclaimer
The information and publications are not meant to be, and do not constitute, financial, investment, trading, or other types of advice or recommendations supplied or endorsed by TradingView. Read more in the Terms of Use.