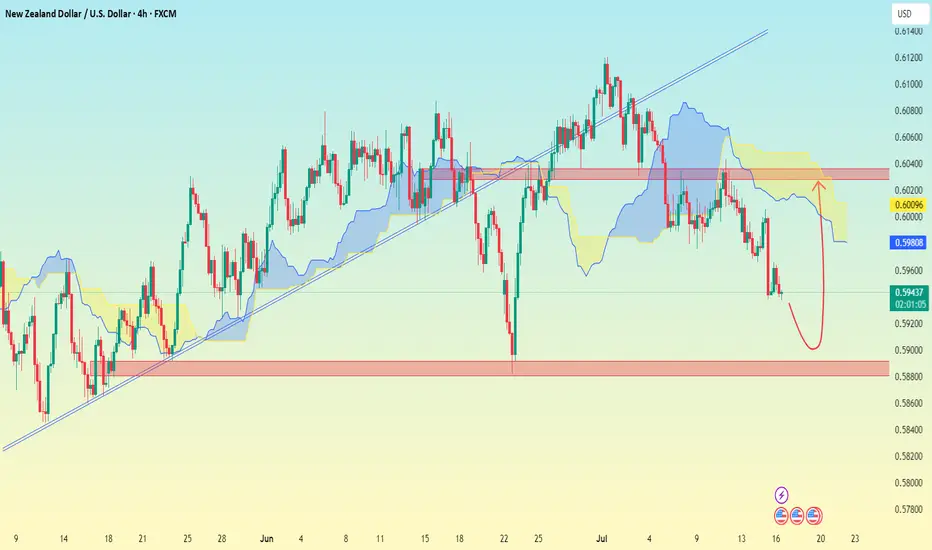
NZD/USD (4H time frame), here's the analysis:
---
📉 Chart Analysis Summary:
Price has broken below the trendline and is currently below the Ichimoku cloud, indicating bearish momentum.
A bearish move is likely continuing toward a strong support zone.
A rebound is drawn on my analysis suggesting a possible bounce after reaching a key demand zone.
---
🎯 Target Levels:
🔻 Bearish Move (Primary Setup):
Sell from: Current zone around 0.59400
Target 1: 0.59000
Target 2 (Main Support Zone): 0.58600
Stop Loss: Above the red horizontal resistance — around 0.60000
---
🔁 Possible Bounce Scenario (Secondary Setup):
If price hits the 0.58600 zone and shows reversal signs:
Buy from: 0.58600 – 0.58800
Target: 0.59800 – 0.60000
---
⚠ Key Zones:
🔴 Resistance: 0.60000 – 0.60200
🟢 Support: 0.58600 – 0.58800
---
📉 Chart Analysis Summary:
Price has broken below the trendline and is currently below the Ichimoku cloud, indicating bearish momentum.
A bearish move is likely continuing toward a strong support zone.
A rebound is drawn on my analysis suggesting a possible bounce after reaching a key demand zone.
---
🎯 Target Levels:
🔻 Bearish Move (Primary Setup):
Sell from: Current zone around 0.59400
Target 1: 0.59000
Target 2 (Main Support Zone): 0.58600
Stop Loss: Above the red horizontal resistance — around 0.60000
---
🔁 Possible Bounce Scenario (Secondary Setup):
If price hits the 0.58600 zone and shows reversal signs:
Buy from: 0.58600 – 0.58800
Target: 0.59800 – 0.60000
---
⚠ Key Zones:
🔴 Resistance: 0.60000 – 0.60200
🟢 Support: 0.58600 – 0.58800
Trade active
activet.me/RSI_Trading_Point4
Forex, gold and crypto signal's with detailed analysis & get consistent results..
t.me/Gold_Analysis_Experiment
Gold signal's with proper TP & SL for high profits opportunities..
Forex, gold and crypto signal's with detailed analysis & get consistent results..
t.me/Gold_Analysis_Experiment
Gold signal's with proper TP & SL for high profits opportunities..
Related publications
Disclaimer
The information and publications are not meant to be, and do not constitute, financial, investment, trading, or other types of advice or recommendations supplied or endorsed by TradingView. Read more in the Terms of Use.
t.me/RSI_Trading_Point4
Forex, gold and crypto signal's with detailed analysis & get consistent results..
t.me/Gold_Analysis_Experiment
Gold signal's with proper TP & SL for high profits opportunities..
Forex, gold and crypto signal's with detailed analysis & get consistent results..
t.me/Gold_Analysis_Experiment
Gold signal's with proper TP & SL for high profits opportunities..
Related publications
Disclaimer
The information and publications are not meant to be, and do not constitute, financial, investment, trading, or other types of advice or recommendations supplied or endorsed by TradingView. Read more in the Terms of Use.