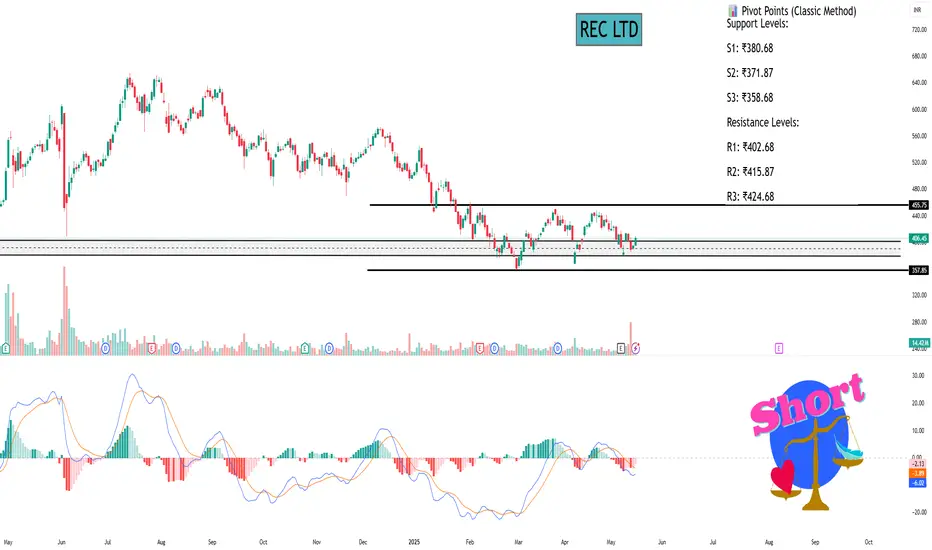
As of May 16, 2025, REC Ltd. (NSE: RECLTD) demonstrated a positive movement on the daily chart, with the stock closing at ₹406.45, marking a 3.07% increase from the previous close of ₹394.35. The day's trading range spanned from a low of ₹395.10 to a high of ₹409.65, with a substantial trading volume of approximately 14.4 million shares, indicating heightened investor interest.
📈 Technical Indicators (Daily Timeframe)
Relative Strength Index (RSI): 53.25 – Positioned in the neutral zone, suggesting neither overbought nor oversold conditions.
Moving Average Convergence Divergence (MACD): 0.37 – A positive value indicating bullish momentum, albeit modest.
Money Flow Index (MFI): 58.15 – Reflects moderate buying pressure, aligning with the day's positive price movement.
Average Directional Index (ADX): 31.99 – Suggests a developing trend strength, which traders should monitor for potential continuation or reversal.
Stochastic Oscillator (20,3): Approximately 55–80 – Indicates a bullish condition, but approaching overbought territory, warranting caution.
Commodity Channel Index (CCI): Positive territory – Signifies that the stock is trading above its average price, supporting the bullish outlook.
📊 Pivot Points (Classic Method)
Support Levels:
S1: ₹380.68
S2: ₹371.87
S3: ₹358.68
Resistance Levels:
R1: ₹402.68
R2: ₹415.87
R3: ₹424.68
The stock's closing price is above the first resistance level (R1), suggesting potential to test higher resistance levels if bullish momentum continues.
🔍 Trend Analysis
Recent technical assessments indicate that REC Ltd. may be entering a critical phase. A head and shoulders pattern was identified on the daily chart, with a breakout observed on March 19, 2024. This pattern typically signals a potential reversal, and the breakout was accompanied by increased trading volume and a bearish signal on the MACD indicator. Currently, the RSI is at a low level, and sustained momentum from the breakout may lead to further downward movement.
⚠️ Investor Considerations
Volatility: The stock has a beta of approximately 2.01, indicating higher volatility compared to the broader market.
Valuation Metrics:
P/E Ratio: 6.74 – Suggests the stock is trading at a relatively low multiple compared to the industry average.
P/B Ratio: 1.35 – Indicates a reasonable valuation in terms of book value.
Dividend Yield: 4.43% – Reflects a strong return to shareholders.
52-Week Range: ₹127.40 – ₹654.00 – The current price is significantly below the 52-week high, offering potential upside if the stock rebounds.
📌 Summary
REC Ltd.'s recent price action and technical indicators suggest a cautiously optimistic outlook. While the stock has shown a positive movement, the presence of a head and shoulders pattern and other technical signals warrant careful monitoring. Investors should watch for confirmation of trend continuation or reversal, particularly around the identified support and resistance levels.
Hello Guys ..
WhatsApp link- wa.link/d997q0
Email - techncialexpress@gmail.com ...
Script Coder/Trader//Investor from India. Drop a comment or DM if you have any questions! Let’s grow together!
WhatsApp link- wa.link/d997q0
Email - techncialexpress@gmail.com ...
Script Coder/Trader//Investor from India. Drop a comment or DM if you have any questions! Let’s grow together!
Related publications
Disclaimer
The information and publications are not meant to be, and do not constitute, financial, investment, trading, or other types of advice or recommendations supplied or endorsed by TradingView. Read more in the Terms of Use.