Long
RMO to break downards trend
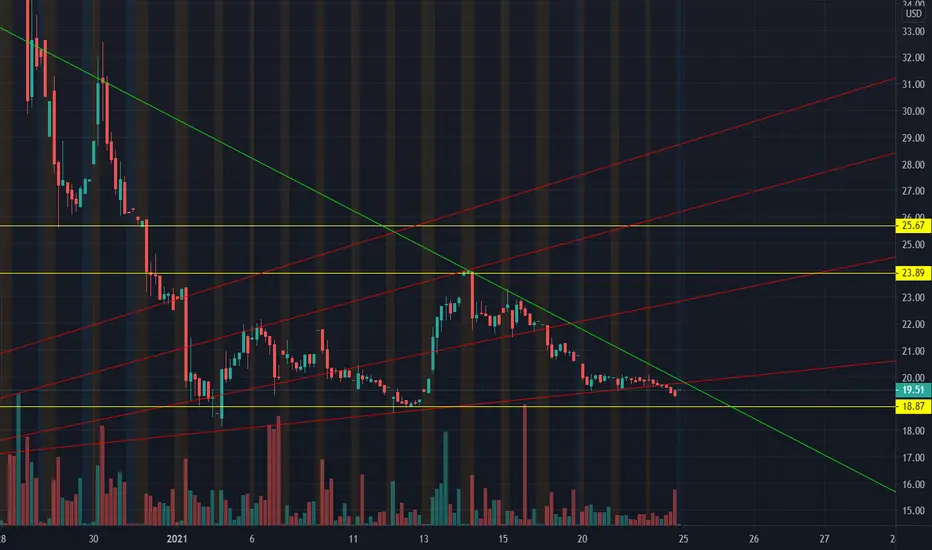
Likely to dip to the 18's before breaking the downward trend (green line).
Two levels of horizontal resistance (yellow lines) and two points of trendline resistance (red lines).
Weekly PT:
Max= $28
Realistic PT = $25
Risk: low 18's
Two levels of horizontal resistance (yellow lines) and two points of trendline resistance (red lines).
Weekly PT:
Max= $28
Realistic PT = $25
Risk: low 18's
Disclaimer
The information and publications are not meant to be, and do not constitute, financial, investment, trading, or other types of advice or recommendations supplied or endorsed by TradingView. Read more in the Terms of Use.
Disclaimer
The information and publications are not meant to be, and do not constitute, financial, investment, trading, or other types of advice or recommendations supplied or endorsed by TradingView. Read more in the Terms of Use.